|
Download Data (XLS File) |
|
||||||||
|
||||||||
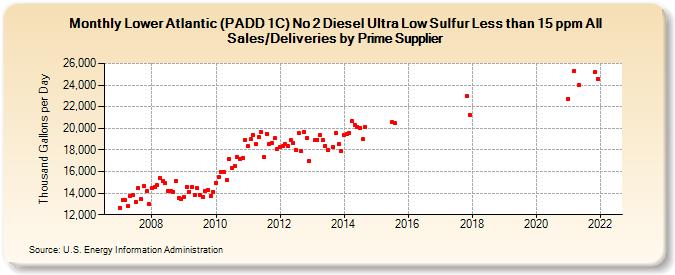
| Lower Atlantic (PADD 1C) No 2 Diesel Ultra Low Sulfur Less than 15 ppm All Sales/Deliveries by Prime Supplier (Thousand Gallons per Day) | ||||||||
| Year | Jan | Feb | Mar | Apr | May | Jun | Jul | Aug | Sep | Oct | Nov | Dec |
|---|---|---|---|---|---|---|---|---|---|---|---|---|
| 2007 | 12,646.4 | 13,386.7 | 13,321.0 | 12,784.7 | 13,772.6 | 13,806.1 | 13,221.8 | 14,427.1 | 13,456.7 | 14,637.3 | 14,183.8 | 13,007.0 |
| 2008 | 14,465.5 | 14,597.6 | 14,710.8 | 15,385.6 | 15,102.7 | 14,923.7 | 14,228.4 | 14,165.4 | 14,133.3 | 15,125.3 | 13,503.8 | 13,427.9 |
| 2009 | 13,674.1 | 14,573.2 | 14,134.3 | 14,535.7 | 13,782.4 | 14,468.6 | 13,854.7 | 13,650.2 | 14,213.9 | 14,295.5 | 13,702.2 | 14,134.2 |
| 2010 | 14,980.5 | 15,458.7 | 15,922.7 | 15,931.9 | 15,248.2 | 17,164.3 | 16,358.0 | 16,492.4 | 17,344.9 | 17,187.0 | 17,279.9 | 18,960.6 |
| 2011 | 18,338.3 | 18,998.9 | 19,364.9 | 18,554.7 | 19,152.0 | 19,678.3 | 17,309.6 | 19,509.9 | 18,503.3 | 18,623.9 | 19,065.3 | 18,111.9 |
| 2012 | 18,298.6 | 18,330.0 | 18,513.7 | 18,359.1 | 18,910.2 | 18,637.1 | 18,005.8 | 19,555.5 | 17,908.5 | 19,687.5 | 19,093.6 | 16,965.0 |
| 2013 | W | 18,886.2 | 18,954.4 | 19,350.0 | 18,896.0 | 18,398.4 | 17,982.8 | W | 18,238.9 | 19,564.3 | 18,556.1 | 17,854.9 |
| 2014 | 19,421.1 | 19,490.9 | 19,561.5 | 20,666.1 | 20,339.6 | 20,139.9 | 20,006.5 | 19,004.1 | 20,161.9 | W | W | W |
| 2015 | W | W | W | W | W | W | 20,579.8 | 20,477.0 | W | W | W | W |
| 2016 | W | W | W | W | W | W | W | W | W | W | W | W |
| 2017 | W | W | W | W | W | W | W | W | W | W | 22,952.9 | 21,264.3 |
| 2018 | W | W | W | W | W | W | W | W | W | W | W | W |
| 2019 | W | W | W | W | W | W | W | W | W | W | W | W |
| 2020 | W | W | W | W | W | W | W | W | W | W | W | W |
| 2021 | 22,746.3 | W | 25,291.6 | W | 24,005.5 | W | W | W | W | W | 25,180.0 | 24,579.7 |
| 2022 | W | W | W | |||||||||
| - = No Data Reported; -- = Not Applicable; NA = Not Available; W = Withheld to avoid disclosure of individual company data. |
| Release Date: 5/19/2022 |
| Next Release Date: TBD |