|
Download Data (XLS File) |
|
||||||||
|
||||||||
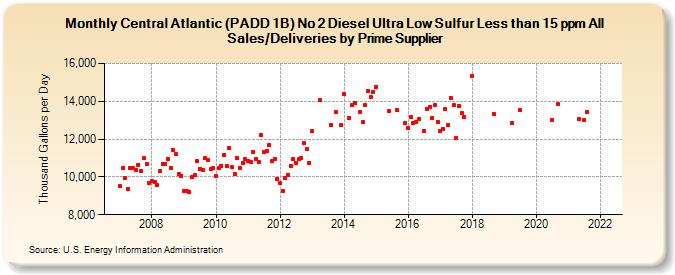
| Central Atlantic (PADD 1B) No 2 Diesel Ultra Low Sulfur Less than 15 ppm All Sales/Deliveries by Prime Supplier (Thousand Gallons per Day) | ||||||||
| Year | Jan | Feb | Mar | Apr | May | Jun | Jul | Aug | Sep | Oct | Nov | Dec |
|---|---|---|---|---|---|---|---|---|---|---|---|---|
| 2007 | 9,496.0 | 10,461.8 | 9,953.5 | 9,365.3 | 10,496.5 | 10,468.3 | 10,352.5 | 10,647.8 | 10,310.9 | 10,996.5 | 10,698.1 | 9,703.2 |
| 2008 | 9,779.8 | 9,718.6 | 9,564.0 | 10,311.5 | 10,705.4 | 10,666.6 | 10,960.3 | 10,497.0 | 11,438.0 | 11,210.8 | 10,176.6 | 10,068.6 |
| 2009 | 9,259.0 | 9,234.9 | 9,191.2 | 10,014.0 | 10,102.0 | 10,838.5 | 10,432.9 | 10,379.5 | 10,994.8 | 10,870.9 | 10,395.7 | 10,453.3 |
| 2010 | 10,029.8 | 10,449.3 | 10,590.2 | 11,179.8 | 10,587.6 | 11,549.5 | 10,502.2 | 10,147.5 | 11,011.6 | 10,451.6 | 10,750.9 | 10,942.3 |
| 2011 | 10,861.8 | 10,772.3 | 11,304.7 | 10,946.1 | 10,770.1 | 12,198.8 | 11,308.7 | 11,368.9 | 11,689.8 | 10,832.9 | 10,956.1 | 9,913.0 |
| 2012 | 9,703.4 | 9,280.5 | 9,950.3 | 10,104.0 | 10,600.1 | 10,923.2 | 10,757.1 | 10,928.2 | 11,008.8 | 11,770.4 | 11,478.9 | 10,749.7 |
| 2013 | 12,424.7 | W | W | 14,091.1 | W | W | W | 12,749.6 | W | 13,416.8 | W | 12,762.0 |
| 2014 | 14,390.9 | W | 13,141.9 | 13,777.8 | 13,900.4 | W | 13,407.2 | 12,909.2 | 13,791.8 | 14,539.4 | 14,225.6 | 14,517.5 |
| 2015 | 14,761.5 | W | W | W | W | 13,502.9 | W | W | 13,551.6 | W | W | 12,856.7 |
| 2016 | 12,607.9 | 13,176.3 | 12,851.5 | 12,930.3 | 13,042.7 | W | 12,441.6 | 13,592.7 | 13,705.1 | 13,101.1 | 13,810.8 | 12,898.3 |
| 2017 | 12,417.8 | 12,512.9 | 13,571.6 | 12,733.9 | 14,188.5 | 13,785.4 | 12,050.2 | 13,748.5 | 13,390.1 | 13,185.7 | W | W |
| 2018 | 15,361.3 | W | W | W | W | W | W | W | 13,349.7 | W | W | W |
| 2019 | W | W | W | 12,853.0 | W | W | 13,557.1 | W | W | W | W | W |
| 2020 | W | W | W | W | W | W | 13,035.4 | W | 13,837.9 | W | W | W |
| 2021 | W | W | W | W | 13,059.0 | W | 12,987.7 | 13,428.2 | W | W | W | W |
| 2022 | W | W | W | |||||||||
| - = No Data Reported; -- = Not Applicable; NA = Not Available; W = Withheld to avoid disclosure of individual company data. |
| Release Date: 5/19/2022 |
| Next Release Date: TBD |