|
Download Data (XLS File) |
|
||||||||
|
||||||||
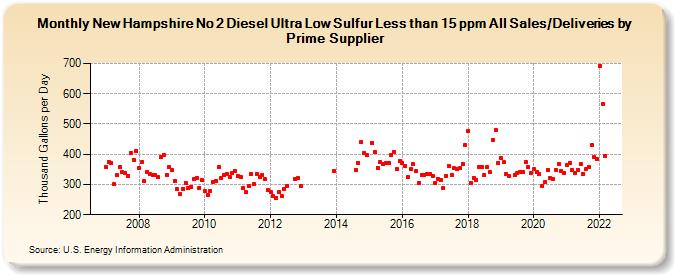
| New Hampshire No 2 Diesel Ultra Low Sulfur Less than 15 ppm All Sales/Deliveries by Prime Supplier (Thousand Gallons per Day) | ||||||||
| Year | Jan | Feb | Mar | Apr | May | Jun | Jul | Aug | Sep | Oct | Nov | Dec |
|---|---|---|---|---|---|---|---|---|---|---|---|---|
| 2007 | 357.0 | 374.3 | 370.9 | 301.5 | 330.9 | 356.1 | 339.9 | 336.7 | 329.0 | 404.2 | 380.2 | 410.1 |
| 2008 | 355.1 | 374.9 | 311.4 | 341.8 | 333.7 | 332.7 | 329.9 | 324.6 | 391.4 | 398.2 | 331.5 | 358.0 |
| 2009 | 347.0 | 310.8 | 283.5 | 267.9 | 285.3 | 306.0 | 286.8 | 293.0 | 317.2 | 322.6 | 289.6 | 314.6 |
| 2010 | 279.1 | 266.4 | 279.3 | 308.2 | 311.7 | 358.6 | 321.6 | 329.7 | 333.8 | 323.4 | 336.9 | 345.3 |
| 2011 | 329.5 | 324.6 | 288.0 | 273.5 | 293.3 | 335.5 | 302.0 | 336.1 | 324.8 | 332.7 | 317.1 | 281.3 |
| 2012 | 274.4 | 260.7 | 256.4 | 273.7 | 261.6 | 285.2 | 296.3 | W | W | 317.5 | 321.0 | 295.3 |
| 2013 | W | W | W | W | W | W | W | W | W | W | W | 345.9 |
| 2014 | W | W | W | W | W | W | W | 348.5 | 372.5 | 441.1 | 403.1 | 396.1 |
| 2015 | W | 438.2 | 406.8 | 355.5 | 374.2 | 366.6 | 369.7 | 369.8 | 397.4 | 408.4 | 349.9 | 377.1 |
| 2016 | 372.2 | 361.0 | 324.1 | 349.9 | 367.9 | 343.0 | 305.9 | 331.5 | 330.6 | 334.6 | 336.2 | 329.4 |
| 2017 | 304.1 | 318.3 | 315.9 | 289.7 | 329.5 | 362.1 | 329.7 | 353.0 | 350.0 | 354.9 | 369.1 | 431.4 |
| 2018 | 476.7 | 305.9 | 322.1 | 314.3 | 356.8 | 358.7 | 330.5 | 357.5 | 340.9 | 448.1 | 480.8 | 372.2 |
| 2019 | 387.8 | 373.4 | 334.6 | 327.6 | W | 331.8 | 338.2 | 339.9 | 340.5 | 373.9 | 357.2 | 338.5 |
| 2020 | 350.1 | 340.1 | 334.5 | 295.1 | 307.1 | 349.4 | 321.3 | 318.5 | 348.0 | 366.4 | 344.4 | 337.5 |
| 2021 | 363.9 | 372.1 | 346.3 | 339.5 | 348.1 | 367.5 | 335.5 | 350.6 | 359.2 | 429.6 | 389.4 | 385.3 |
| 2022 | 692.7 | 566.9 | 394.6 | |||||||||
| - = No Data Reported; -- = Not Applicable; NA = Not Available; W = Withheld to avoid disclosure of individual company data. |
| Release Date: 5/19/2022 |
| Next Release Date: TBD |