|
Download Data (XLS File) |
|
||||||||
|
||||||||
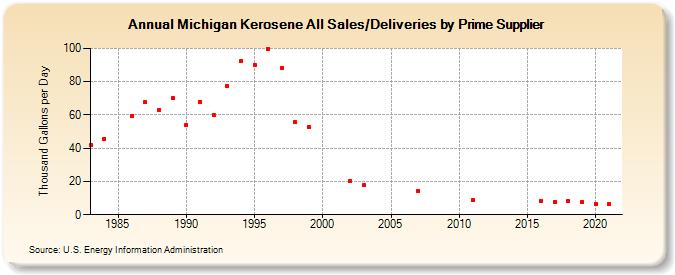
| Michigan Kerosene All Sales/Deliveries by Prime Supplier (Thousand Gallons per Day) | ||||||||
| Decade | Year-0 | Year-1 | Year-2 | Year-3 | Year-4 | Year-5 | Year-6 | Year-7 | Year-8 | Year-9 |
|---|---|---|---|---|---|---|---|---|---|---|
| 1980's | 41.9 | 45.8 | W | 59.4 | 67.6 | 63.0 | 70.4 | |||
| 1990's | 53.9 | 67.8 | 60.0 | 77.2 | 92.2 | 90.3 | 99.8 | 88.3 | 55.7 | 52.9 |
| 2000's | W | W | 20.4 | 17.6 | W | W | W | 14.5 | W | W |
| 2010's | W | 9.1 | W | W | W | W | 8.2 | 7.8 | 8.0 | 7.8 |
| 2020's | 6.5 |
| - = No Data Reported; -- = Not Applicable; NA = Not Available; W = Withheld to avoid disclosure of individual company data. |
| Release Date: 6/1/2022 |
| Next Release Date: TBD |