|
Download Data (XLS File) |
|
||||||||
|
||||||||
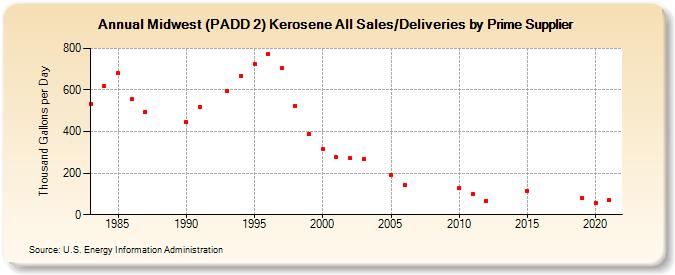
| Midwest (PADD 2) Kerosene All Sales/Deliveries by Prime Supplier (Thousand Gallons per Day) | ||||||||
| Decade | Year-0 | Year-1 | Year-2 | Year-3 | Year-4 | Year-5 | Year-6 | Year-7 | Year-8 | Year-9 |
|---|---|---|---|---|---|---|---|---|---|---|
| 1980's | 534.3 | 618.2 | 679.8 | 554.5 | 494.3 | W | W | |||
| 1990's | 445.0 | 518.8 | W | 597.2 | 667.9 | 724.5 | 774.9 | 703.8 | 523.5 | 385.9 |
| 2000's | 316.2 | 276.5 | 271.5 | 269.0 | W | 190.2 | 141.4 | W | W | W |
| 2010's | 127.8 | 97.9 | 67.3 | W | W | 115.8 | W | W | W | 82.0 |
| 2020's | 57.7 |
| - = No Data Reported; -- = Not Applicable; NA = Not Available; W = Withheld to avoid disclosure of individual company data. |
| Release Date: 6/1/2022 |
| Next Release Date: TBD |