|
Download Data (XLS File) |
|
||||||||
|
||||||||
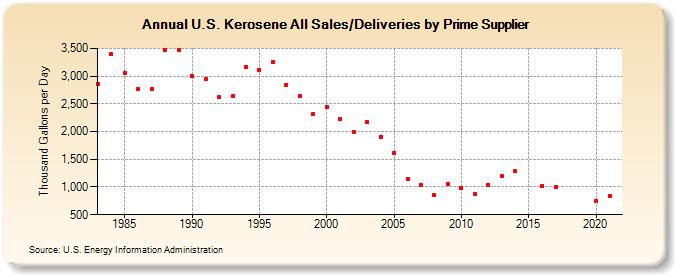
| U.S. Kerosene All Sales/Deliveries by Prime Supplier (Thousand Gallons per Day) | ||||||||
| Decade | Year-0 | Year-1 | Year-2 | Year-3 | Year-4 | Year-5 | Year-6 | Year-7 | Year-8 | Year-9 |
|---|---|---|---|---|---|---|---|---|---|---|
| 1980's | 2,856.8 | 3,394.2 | 3,053.2 | 2,773.8 | 2,770.7 | 3,478.9 | 3,476.6 | |||
| 1990's | 2,993.6 | 2,946.8 | 2,616.2 | 2,643.8 | 3,169.1 | 3,117.8 | 3,257.9 | 2,838.2 | 2,643.4 | 2,314.7 |
| 2000's | 2,448.3 | 2,234.4 | 2,000.0 | 2,164.5 | 1,909.6 | 1,618.0 | 1,147.9 | 1,032.4 | 857.9 | 1,054.2 |
| 2010's | 980.9 | 865.6 | 1,043.9 | 1,199.0 | 1,282.7 | W | 1,020.4 | 997.7 | W | W |
| 2020's | 738.9 |
| - = No Data Reported; -- = Not Applicable; NA = Not Available; W = Withheld to avoid disclosure of individual company data. |
| Release Date: 6/1/2022 |
| Next Release Date: TBD |