|
Download Data (XLS File) |
|
||||||||
|
||||||||
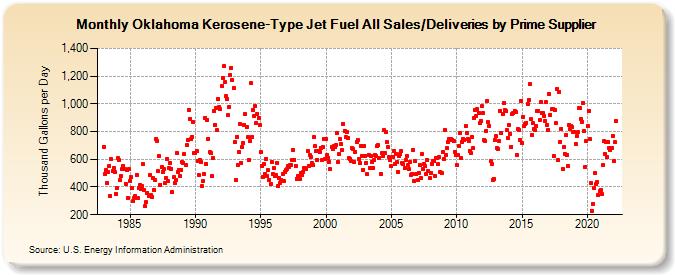
| Oklahoma Kerosene-Type Jet Fuel All Sales/Deliveries by Prime Supplier (Thousand Gallons per Day) | ||||||||
| Year | Jan | Feb | Mar | Apr | May | Jun | Jul | Aug | Sep | Oct | Nov | Dec |
|---|---|---|---|---|---|---|---|---|---|---|---|---|
| 1983 | 690.4 | 494.4 | 519.1 | 430.7 | 508.0 | 555.0 | 337.3 | 599.0 | 511.9 | 538.9 | 506.0 | 352.7 |
| 1984 | 391.9 | 606.5 | 593.3 | 447.3 | 479.2 | 527.7 | 552.0 | 530.3 | 424.1 | 520.3 | 321.1 | 526.5 |
| 1985 | 446.3 | 468.9 | 390.4 | 295.9 | 318.9 | 336.6 | 487.9 | 318.8 | 392.5 | 413.4 | 384.3 | 410.3 |
| 1986 | 563.6 | 375.0 | 260.1 | 288.8 | 356.9 | 333.1 | 487.6 | 341.5 | 330.2 | 463.8 | 381.5 | 450.3 |
| 1987 | 748.5 | 734.1 | 512.2 | 621.2 | 415.9 | 542.9 | 511.6 | 529.2 | 425.6 | 468.2 | 600.2 | 441.2 |
| 1988 | 537.4 | 573.0 | 532.6 | 361.9 | 470.2 | 430.2 | 450.0 | 645.3 | 510.4 | 524.6 | 477.7 | 524.9 |
| 1989 | 580.5 | 573.2 | 635.9 | 557.7 | 702.8 | 739.2 | 954.2 | 892.3 | 742.8 | 762.9 | 870.4 | 644.2 |
| 1990 | 647.3 | 662.1 | 590.9 | 487.4 | 598.1 | 580.2 | 405.1 | 440.3 | 493.6 | 899.8 | 565.0 | 886.0 |
| 1991 | 749.7 | 652.4 | 642.8 | 477.8 | 608.2 | 944.9 | 850.5 | 971.8 | 808.9 | 1,035.7 | 976.5 | 961.3 |
| 1992 | 1,127.8 | 1,189.1 | 1,269.7 | 1,155.0 | 1,053.5 | 1,037.5 | 916.8 | 979.5 | 1,208.6 | 1,260.9 | 1,172.6 | 1,114.8 |
| 1993 | 724.5 | 451.4 | 761.9 | 555.3 | 653.5 | 855.7 | 576.6 | 688.9 | 718.8 | 845.6 | 923.9 | 834.6 |
| 1994 | 757.5 | 597.4 | 728.8 | 1,147.8 | 762.0 | 954.1 | 909.8 | 980.8 | 861.8 | 929.4 | 897.8 | 846.0 |
| 1995 | 650.2 | 550.0 | 474.8 | 562.6 | 494.3 | 603.3 | 478.9 | 519.5 | 452.9 | 421.8 | 579.0 | 493.4 |
| 1996 | 540.5 | 477.4 | 485.9 | 573.5 | 409.9 | 467.4 | 427.6 | 449.7 | 497.0 | 446.7 | 506.5 | 519.7 |
| 1997 | 529.7 | 548.1 | 541.5 | 558.0 | 556.8 | 593.1 | 666.0 | 595.6 | 555.0 | 460.2 | 478.2 | 454.6 |
| 1998 | 454.8 | 502.2 | 488.8 | 509.4 | 536.5 | 537.7 | 531.8 | 659.4 | 553.8 | 629.5 | 614.8 | 575.6 |
| 1999 | 557.2 | 758.4 | 692.5 | 658.7 | 597.1 | 656.1 | 653.6 | 684.7 | 595.8 | 691.8 | 748.5 | 598.5 |
| 2000 | 744.9 | 628.0 | 612.7 | 582.2 | 527.2 | 688.4 | 671.7 | 694.1 | 685.2 | 704.4 | 787.0 | 578.6 |
| 2001 | 640.7 | 743.0 | 712.1 | 665.6 | 855.0 | 806.8 | 760.8 | 795.3 | 757.0 | 610.9 | 603.3 | 586.1 |
| 2002 | 679.8 | 674.0 | 581.3 | 653.5 | 723.5 | 736.9 | 598.9 | 573.8 | 699.3 | 625.6 | 525.0 | 695.1 |
| 2003 | 626.5 | 574.8 | 491.5 | 632.1 | 535.5 | 621.3 | 582.6 | 538.3 | 597.7 | 631.5 | 624.9 | 692.6 |
| 2004 | 701.1 | 612.4 | 493.2 | 642.1 | 626.4 | 809.8 | 643.7 | 794.1 | 726.9 | 686.4 | 618.4 | 596.4 |
| 2005 | 548.2 | 616.4 | 660.0 | 563.0 | 639.3 | 578.5 | 510.9 | 622.8 | 637.3 | 659.1 | 575.6 | 563.5 |
| 2006 | 533.5 | 595.3 | 626.8 | 557.3 | 527.5 | 583.4 | 489.6 | 495.1 | 668.6 | 445.7 | 587.8 | 492.6 |
| 2007 | 448.4 | 503.0 | 555.6 | 462.0 | 638.5 | 532.5 | 564.1 | 548.8 | 490.8 | 594.8 | 513.7 | 464.4 |
| 2008 | 499.3 | 566.5 | 584.8 | 591.0 | 482.4 | 610.5 | 605.9 | 563.6 | 615.9 | 509.2 | 501.8 | 653.0 |
| 2009 | 603.2 | 814.5 | 632.8 | 680.0 | 725.2 | 748.7 | 737.0 | 743.6 | 741.7 | 731.8 | 655.7 | 634.0 |
| 2010 | 556.9 | 630.3 | 699.1 | 786.2 | 608.5 | 725.8 | 748.6 | 742.5 | 841.7 | 790.2 | 745.1 | 732.3 |
| 2011 | 660.7 | 643.0 | 761.5 | 679.3 | 898.4 | 958.6 | 912.9 | 960.4 | 937.2 | 864.2 | 878.7 | 981.4 |
| 2012 | 936.7 | 742.0 | 730.6 | 807.3 | 1,023.2 | 867.0 | 842.4 | 584.6 | 569.0 | 452.6 | 459.8 | 741.3 |
| 2013 | 765.4 | 681.6 | 671.6 | 730.7 | 946.9 | 787.9 | 924.0 | 1,008.2 | 956.8 | 947.7 | 808.0 | 750.1 |
| 2014 | 848.5 | 785.7 | 691.7 | 926.3 | 933.6 | 945.8 | 938.1 | 633.2 | 816.5 | 812.5 | 742.0 | 1,023.2 |
| 2015 | 714.0 | 907.3 | 842.5 | 855.3 | 863.8 | 1,000.2 | 1,030.3 | 1,140.9 | 889.2 | 776.5 | 859.0 | 822.0 |
| 2016 | 810.4 | 842.2 | 949.2 | 949.3 | 880.3 | 1,010.5 | 930.5 | 935.2 | 913.2 | 878.1 | 1,010.1 | 846.1 |
| 2017 | 812.4 | 1,070.6 | 918.7 | 959.2 | 961.5 | 624.7 | 954.8 | 858.2 | 1,105.3 | 593.7 | 1,088.6 | 727.6 |
| 2018 | 821.0 | 530.6 | 690.1 | 639.2 | 774.7 | 629.7 | 552.5 | 848.0 | 815.3 | 839.3 | 829.9 | 796.9 |
| 2019 | 800.1 | 712.2 | 767.0 | 793.5 | 966.9 | 970.2 | 890.2 | 871.6 | 1,005.6 | 800.7 | 546.3 | 735.2 |
| 2020 | 842.4 | 946.5 | 744.0 | 428.3 | 228.7 | 277.8 | 395.3 | 500.7 | 419.1 | 437.1 | 340.3 | 368.2 |
| 2021 | 380.7 | 348.5 | 555.6 | 730.0 | 638.4 | 721.7 | 613.4 | 721.1 | 680.7 | 670.3 | 682.0 | 771.3 |
| 2022 | 587.1 | 722.7 | 878.0 | |||||||||
| - = No Data Reported; -- = Not Applicable; NA = Not Available; W = Withheld to avoid disclosure of individual company data. |
| Release Date: 5/19/2022 |
| Next Release Date: TBD |