|
Download Data (XLS File) |
|
||||||||
|
||||||||
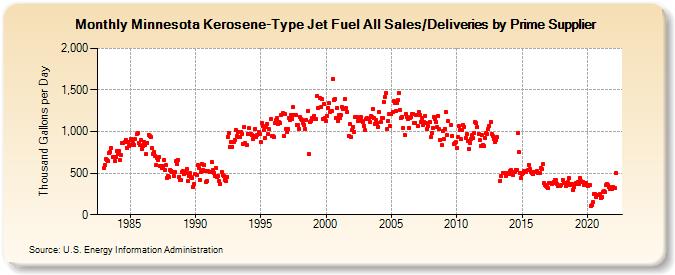
| Minnesota Kerosene-Type Jet Fuel All Sales/Deliveries by Prime Supplier (Thousand Gallons per Day) | ||||||||
| Year | Jan | Feb | Mar | Apr | May | Jun | Jul | Aug | Sep | Oct | Nov | Dec |
|---|---|---|---|---|---|---|---|---|---|---|---|---|
| 1983 | 561.2 | 602.2 | 667.3 | 658.1 | 641.5 | 739.4 | 759.6 | 799.4 | 699.8 | 695.1 | 642.0 | 690.4 |
| 1984 | 765.1 | 729.0 | 764.5 | 656.0 | 717.4 | 865.5 | 868.0 | 873.5 | 903.0 | 804.4 | 870.8 | 827.7 |
| 1985 | 842.4 | 916.0 | 896.8 | 860.4 | 835.6 | 905.8 | 964.8 | 979.8 | 867.1 | 833.5 | 895.8 | 795.0 |
| 1986 | 824.3 | 876.1 | 832.6 | 725.4 | 866.6 | 963.6 | 945.1 | 935.8 | 801.8 | 734.5 | 753.0 | 709.0 |
| 1987 | 595.1 | 683.0 | 659.7 | 693.3 | 584.9 | 557.7 | 580.4 | 659.7 | 532.1 | 597.7 | 443.3 | 464.4 |
| 1988 | 452.5 | 537.2 | 530.7 | 514.9 | 467.5 | 508.5 | 644.9 | 612.5 | 661.4 | 457.9 | 414.7 | 411.7 |
| 1989 | 518.8 | 520.7 | 493.5 | 498.5 | 552.1 | 411.3 | 465.5 | 500.5 | 449.7 | 443.0 | 334.9 | 367.3 |
| 1990 | 486.3 | 474.9 | 597.4 | 563.3 | 421.3 | 515.5 | 610.9 | 540.1 | 599.8 | 520.5 | 387.5 | 404.0 |
| 1991 | 523.5 | 513.5 | 516.2 | 630.1 | 540.3 | 501.0 | 463.2 | 562.5 | 454.2 | 462.8 | 400.2 | 370.5 |
| 1992 | 512.8 | 475.2 | 461.6 | 422.4 | 403.5 | 453.8 | 936.1 | 981.7 | 813.0 | 879.1 | 817.5 | 868.5 |
| 1993 | 897.4 | 1,021.6 | 940.9 | 989.4 | 932.6 | 928.8 | 997.1 | 975.9 | 855.4 | 1,058.5 | 859.0 | 836.0 |
| 1994 | 972.6 | 1,039.5 | 973.1 | 973.9 | 960.9 | 905.2 | 942.5 | 1,036.4 | 937.7 | 955.7 | 994.1 | 974.4 |
| 1995 | 869.5 | 1,101.9 | 1,061.0 | 1,021.6 | 923.1 | 1,055.2 | 1,092.8 | 970.1 | 1,029.2 | 1,145.4 | 943.7 | 949.0 |
| 1996 | 934.0 | 1,102.5 | 1,136.8 | 1,158.9 | 1,085.3 | 1,114.8 | 1,106.7 | 1,197.6 | 1,218.3 | 950.3 | 1,213.8 | 1,030.0 |
| 1997 | 999.0 | 1,027.8 | 1,161.6 | 1,136.3 | 1,204.1 | 1,152.1 | 1,295.0 | 1,204.4 | 1,202.3 | 1,081.7 | 1,076.0 | 1,035.3 |
| 1998 | 1,175.4 | 1,156.5 | 1,144.0 | 1,106.7 | 1,080.7 | 1,034.4 | 1,133.6 | 1,248.5 | 724.9 | 1,112.0 | 1,125.8 | 1,163.8 |
| 1999 | 1,164.2 | 1,191.5 | 1,147.1 | 1,150.9 | 1,423.8 | 1,282.3 | 1,407.8 | 1,291.6 | 1,396.2 | 1,148.1 | 1,328.2 | 1,157.1 |
| 2000 | 1,126.4 | 1,191.0 | 1,284.7 | 1,342.4 | 1,238.5 | 1,248.8 | 1,633.0 | 1,383.7 | 1,394.2 | 1,167.9 | 1,288.7 | 1,129.1 |
| 2001 | 1,193.2 | 1,158.1 | 1,193.9 | 1,294.2 | 1,272.5 | 1,388.6 | 1,282.9 | 1,240.3 | W | 950.9 | 1,093.6 | 931.2 |
| 2002 | 1,022.0 | 1,058.5 | 998.9 | 1,169.0 | 1,181.0 | 1,122.6 | 1,150.2 | 1,161.2 | 1,172.6 | 1,125.6 | 1,115.5 | 1,072.4 |
| 2003 | 1,013.6 | 1,148.3 | 1,159.7 | 1,151.0 | 1,120.5 | 1,185.5 | 1,172.7 | 1,271.9 | 1,158.3 | 1,094.2 | 1,142.2 | 1,105.8 |
| 2004 | 1,060.0 | 1,230.0 | 1,116.6 | 1,167.2 | 1,168.7 | 1,355.4 | 1,420.2 | 1,462.8 | 1,030.6 | 1,130.1 | 1,207.5 | 1,061.8 |
| 2005 | 1,210.6 | 1,237.9 | 1,364.0 | 1,338.5 | 1,242.7 | 1,341.1 | 1,376.6 | 1,463.6 | 1,260.0 | 1,166.8 | 1,178.9 | 1,042.7 |
| 2006 | 963.1 | 1,216.7 | 1,169.4 | 1,145.5 | 1,043.3 | 1,167.9 | 1,175.7 | 1,214.8 | 1,210.4 | 1,108.8 | 1,103.0 | 1,200.2 |
| 2007 | 1,069.4 | 1,232.9 | 1,197.5 | 1,113.7 | 1,167.2 | 1,076.7 | 1,113.3 | 1,181.1 | 1,102.8 | 1,033.5 | 1,064.5 | 1,116.8 |
| 2008 | 931.6 | 986.5 | 1,046.5 | 1,178.5 | 1,147.6 | 1,112.6 | 1,052.3 | 1,190.8 | 1,024.9 | 902.1 | 837.2 | 1,006.2 |
| 2009 | 908.8 | 1,035.4 | 1,236.7 | 953.4 | 1,128.7 | W | W | 1,082.1 | 947.2 | 851.8 | 863.6 | 872.8 |
| 2010 | 804.9 | 930.0 | 1,068.9 | 1,020.1 | 905.3 | 1,017.1 | 1,081.4 | 1,060.7 | 928.1 | 965.1 | 887.7 | 789.8 |
| 2011 | 868.1 | 912.5 | 954.5 | 925.2 | 977.0 | 1,110.6 | 1,097.1 | 1,053.4 | 975.1 | 897.1 | 827.7 | 953.4 |
| 2012 | 842.3 | 821.3 | 924.1 | 981.8 | 973.5 | 1,031.1 | 1,068.0 | 1,117.7 | 970.7 | 948.5 | 909.1 | 877.8 |
| 2013 | 898.5 | 932.0 | NA | NA | 409.6 | 467.2 | 502.1 | 501.5 | 497.2 | 466.0 | 486.5 | 497.5 |
| 2014 | 486.2 | 527.9 | 536.4 | 502.0 | 480.4 | 516.6 | 543.6 | 541.9 | 980.3 | 752.6 | 507.6 | 445.7 |
| 2015 | 484.9 | 505.3 | 523.4 | 520.8 | 510.0 | 534.6 | 603.4 | 552.6 | 517.4 | 502.0 | 486.2 | 518.9 |
| 2016 | 515.4 | 510.2 | 520.5 | 502.9 | 502.5 | 563.9 | 544.8 | 605.4 | 377.5 | 362.0 | 345.3 | 334.6 |
| 2017 | 318.1 | 376.1 | 379.2 | 364.4 | 380.1 | 396.9 | 413.8 | 423.3 | 372.3 | 345.9 | 345.4 | 347.5 |
| 2018 | 362.4 | 421.5 | 387.2 | 386.4 | 349.8 | 368.5 | 398.9 | 437.3 | 359.3 | 368.8 | 365.3 | 299.5 |
| 2019 | 331.5 | 379.5 | 367.5 | 395.5 | 374.4 | 440.1 | 405.0 | 391.7 | 398.0 | 352.5 | 371.8 | 382.7 |
| 2020 | 350.9 | 362.8 | 352.3 | 101.9 | 113.1 | 152.0 | 251.7 | 250.4 | 209.1 | 231.3 | 233.0 | 246.2 |
| 2021 | 202.3 | 214.9 | 275.3 | 281.2 | 274.3 | 354.8 | 374.5 | 354.8 | 332.2 | 306.1 | 315.2 | 338.6 |
| 2022 | 318.9 | 315.8 | 500.2 | |||||||||
| - = No Data Reported; -- = Not Applicable; NA = Not Available; W = Withheld to avoid disclosure of individual company data. |
| Release Date: 5/19/2022 |
| Next Release Date: TBD |