|
Download Data (XLS File) |
|
||||||||
|
||||||||
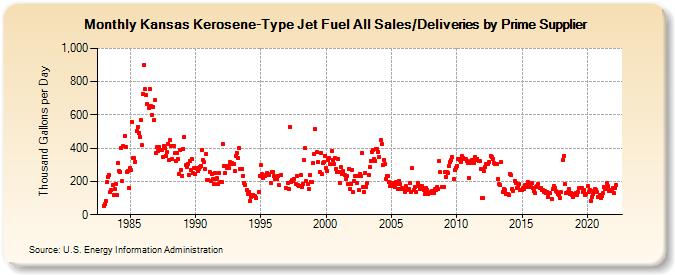
| Kansas Kerosene-Type Jet Fuel All Sales/Deliveries by Prime Supplier (Thousand Gallons per Day) | ||||||||
| Year | Jan | Feb | Mar | Apr | May | Jun | Jul | Aug | Sep | Oct | Nov | Dec |
|---|---|---|---|---|---|---|---|---|---|---|---|---|
| 1983 | 55.3 | 62.0 | 83.6 | 197.0 | 228.2 | 238.7 | 134.0 | 147.0 | 175.9 | 118.2 | 156.6 | 187.5 |
| 1984 | 119.0 | 312.0 | 265.7 | 256.7 | 399.5 | 200.1 | 411.0 | 473.9 | 405.5 | 257.6 | 260.5 | 160.2 |
| 1985 | 283.7 | 266.1 | 556.8 | 341.0 | 339.9 | 319.5 | 502.7 | 529.6 | 490.8 | 468.8 | 571.8 | 416.8 |
| 1986 | 727.2 | 902.2 | 752.9 | 719.5 | 664.5 | 643.3 | 758.4 | 655.5 | 600.2 | 650.6 | 571.2 | 687.5 |
| 1987 | 373.5 | 407.8 | 382.3 | 406.5 | 390.0 | 391.2 | 344.1 | 412.0 | 398.4 | 350.8 | 376.8 | 426.3 |
| 1988 | 326.3 | 447.4 | 411.5 | 334.6 | 415.7 | 368.7 | 325.5 | 370.3 | 337.3 | 242.6 | 390.4 | 271.0 |
| 1989 | 235.7 | 396.9 | 468.7 | 296.2 | 286.1 | 307.5 | 241.4 | 322.5 | 267.4 | 332.1 | 250.0 | 279.9 |
| 1990 | 243.8 | 282.1 | 263.4 | 276.5 | 287.2 | 294.1 | 387.6 | 330.1 | 315.0 | 272.6 | 367.2 | 209.2 |
| 1991 | 206.7 | 258.9 | 205.0 | 243.2 | 211.9 | 184.3 | 249.5 | 215.1 | 218.2 | 182.6 | 250.0 | 198.7 |
| 1992 | 194.6 | 425.8 | 291.3 | 250.6 | 293.0 | 281.9 | 293.8 | 282.0 | 316.7 | 307.1 | 311.2 | 304.0 |
| 1993 | 261.5 | 355.9 | 373.3 | 343.3 | 399.3 | 274.5 | 275.0 | 277.7 | 235.3 | 190.7 | 178.9 | 150.4 |
| 1994 | 126.5 | 135.6 | 82.1 | 109.4 | 119.5 | 120.5 | 112.0 | 110.8 | 100.4 | W | 138.5 | 234.1 |
| 1995 | 297.9 | 242.9 | 218.8 | 231.0 | 230.5 | 240.0 | 249.5 | 242.6 | 240.0 | 192.4 | 259.0 | 259.6 |
| 1996 | 230.8 | 212.8 | 211.9 | 213.1 | 230.2 | 176.0 | W | 239.7 | W | W | W | 160.0 |
| 1997 | W | 193.5 | 152.5 | 530.1 | 197.3 | 206.7 | 202.4 | 216.3 | 186.5 | 233.7 | 175.8 | 171.6 |
| 1998 | 174.6 | 235.8 | 169.6 | 187.4 | 327.1 | 398.4 | 201.7 | 185.3 | 152.9 | 238.8 | 199.2 | 196.3 |
| 1999 | 309.2 | 366.2 | 513.2 | NA | 375.8 | 316.5 | 254.9 | 372.0 | 242.9 | 308.1 | 316.7 | 355.9 |
| 2000 | 283.7 | 263.5 | 330.5 | 341.7 | 303.6 | 384.1 | 330.8 | 303.4 | 338.8 | 277.5 | 255.8 | 337.7 |
| 2001 | 259.4 | 193.6 | 284.1 | 245.9 | 261.2 | 240.3 | 215.1 | 230.2 | 185.3 | 276.2 | 156.5 | 183.7 |
| 2002 | 271.5 | 135.3 | 203.6 | 231.4 | 190.4 | 232.3 | 147.8 | 247.7 | 232.0 | 371.6 | 167.0 | 138.5 |
| 2003 | 253.5 | 169.1 | 192.6 | 240.2 | 284.4 | 325.7 | 379.2 | 388.9 | 337.7 | 325.4 | 395.2 | 395.1 |
| 2004 | 377.8 | 346.3 | 446.5 | 425.2 | 299.3 | 330.0 | 303.3 | 215.6 | 233.0 | 235.5 | 193.9 | 173.7 |
| 2005 | 171.2 | 193.2 | 184.4 | 166.6 | 196.1 | 186.4 | 157.6 | 202.7 | 182.7 | 157.1 | 160.1 | 157.5 |
| 2006 | 137.6 | 170.3 | 147.8 | 153.7 | 155.8 | 188.7 | 138.1 | 279.3 | NA | 149.1 | 169.5 | 133.7 |
| 2007 | 192.9 | 172.2 | 156.7 | 155.1 | 174.9 | 156.2 | 149.8 | 124.4 | 159.7 | 147.2 | 125.5 | 128.7 |
| 2008 | 138.3 | 145.5 | 134.5 | 133.5 | 154.2 | 150.4 | 167.0 | 151.7 | 323.6 | 255.5 | 168.1 | NA |
| 2009 | 168.0 | 258.3 | 228.9 | 256.2 | 249.5 | 293.0 | 314.3 | 327.7 | 344.3 | 211.8 | 268.4 | 283.5 |
| 2010 | 295.5 | 333.1 | 335.9 | 329.1 | 317.9 | 354.1 | 342.1 | 337.9 | 332.4 | 325.0 | 311.5 | 218.0 |
| 2011 | 313.5 | 325.7 | 327.7 | 326.4 | 313.9 | 345.0 | 331.2 | 336.5 | 322.5 | 321.6 | 276.9 | 102.7 |
| 2012 | 101.3 | 259.9 | 287.7 | 303.0 | 305.6 | 306.7 | 317.2 | 351.5 | 344.8 | 334.6 | 310.4 | 304.9 |
| 2013 | 306.5 | 302.9 | 214.5 | 182.1 | 180.3 | 315.7 | 135.5 | 152.9 | 146.7 | 121.7 | 127.2 | 125.0 |
| 2014 | 116.5 | 247.6 | 236.7 | 152.0 | 144.5 | 204.4 | 189.6 | 159.0 | 165.0 | 183.7 | 147.6 | 146.5 |
| 2015 | 150.6 | 157.9 | 155.0 | 176.5 | 166.2 | 199.5 | 182.7 | 169.5 | 169.5 | 191.9 | 160.3 | 143.6 |
| 2016 | 128.9 | 169.3 | 175.5 | 185.1 | 157.8 | 160.0 | 147.2 | 148.3 | 137.3 | 141.1 | 133.4 | 134.6 |
| 2017 | 108.4 | 132.5 | 128.6 | 97.3 | 153.4 | 172.3 | 163.4 | 140.8 | 135.2 | 123.8 | 121.5 | 102.8 |
| 2018 | 134.3 | 327.8 | 352.6 | 185.0 | 129.5 | 131.0 | 135.0 | 153.5 | 121.8 | 130.1 | 118.8 | 108.6 |
| 2019 | 121.9 | 133.4 | 120.1 | 138.0 | 158.7 | 158.9 | 161.2 | 158.5 | 136.7 | 148.9 | 119.3 | 127.0 |
| 2020 | 170.4 | 138.5 | 151.3 | 82.9 | 105.4 | 126.6 | 144.6 | 154.2 | 150.5 | 134.9 | 106.7 | 120.1 |
| 2021 | 102.5 | 114.1 | 127.6 | 169.1 | 155.2 | 154.6 | 190.1 | 170.2 | 141.4 | 147.4 | 139.8 | 159.7 |
| 2022 | 130.3 | 157.9 | 178.1 | |||||||||
| - = No Data Reported; -- = Not Applicable; NA = Not Available; W = Withheld to avoid disclosure of individual company data. |
| Release Date: 5/19/2022 |
| Next Release Date: TBD |