|
Download Data (XLS File) |
|
||||||||
|
||||||||
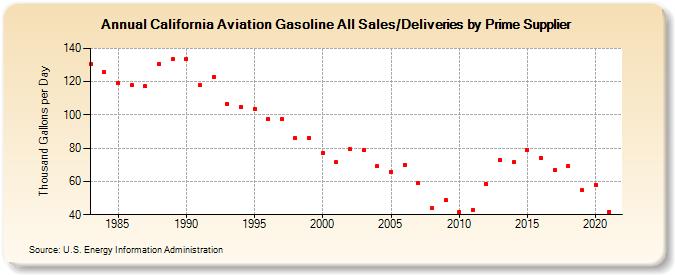
| California Aviation Gasoline All Sales/Deliveries by Prime Supplier (Thousand Gallons per Day) | ||||||||
| Decade | Year-0 | Year-1 | Year-2 | Year-3 | Year-4 | Year-5 | Year-6 | Year-7 | Year-8 | Year-9 |
|---|---|---|---|---|---|---|---|---|---|---|
| 1980's | 130.4 | 125.6 | 119.2 | 117.8 | 117.2 | 130.7 | 133.4 | |||
| 1990's | 133.5 | 118.1 | 122.8 | 106.7 | 104.7 | 103.5 | 97.6 | 97.6 | 86.1 | 86.4 |
| 2000's | 77.3 | 71.5 | 79.4 | 78.7 | 69.1 | 65.8 | 70.1 | 59.2 | 43.8 | 48.6 |
| 2010's | 41.7 | 42.9 | 58.4 | 73.0 | 71.6 | 79.2 | 74.0 | 66.8 | 69.2 | 54.6 |
| 2020's | 57.9 |
| - = No Data Reported; -- = Not Applicable; NA = Not Available; W = Withheld to avoid disclosure of individual company data. |
| Release Date: 6/1/2022 |
| Next Release Date: TBD |