|
Download Data (XLS File) |
|
||||||||
|
||||||||
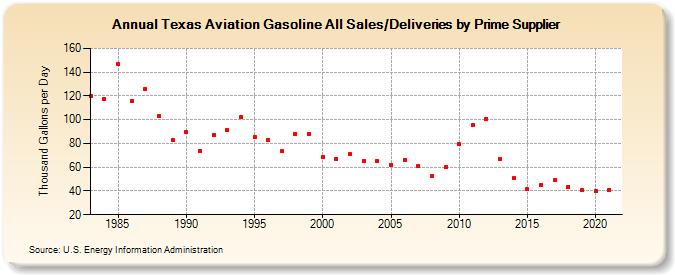
| Texas Aviation Gasoline All Sales/Deliveries by Prime Supplier (Thousand Gallons per Day) | ||||||||
| Decade | Year-0 | Year-1 | Year-2 | Year-3 | Year-4 | Year-5 | Year-6 | Year-7 | Year-8 | Year-9 |
|---|---|---|---|---|---|---|---|---|---|---|
| 1980's | 120.0 | 117.3 | 146.6 | 116.0 | 126.0 | 103.0 | 82.7 | |||
| 1990's | 89.6 | 73.8 | 87.0 | 91.4 | 102.0 | 85.6 | 83.3 | 73.4 | 88.0 | 88.2 |
| 2000's | 68.5 | 66.7 | 70.9 | 65.6 | 65.2 | 62.0 | 66.4 | 60.9 | 52.5 | 59.9 |
| 2010's | 79.2 | 95.3 | 100.9 | 67.3 | 51.0 | 41.4 | 44.9 | 49.0 | 43.6 | 40.7 |
| 2020's | 39.6 |
| - = No Data Reported; -- = Not Applicable; NA = Not Available; W = Withheld to avoid disclosure of individual company data. |
| Release Date: 6/1/2022 |
| Next Release Date: TBD |