|
Download Data (XLS File) |
|
||||||||
|
||||||||
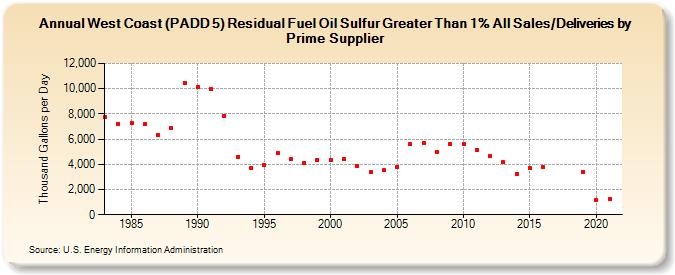
| West Coast (PADD 5) Residual Fuel Oil Sulfur Greater Than 1% All Sales/Deliveries by Prime Supplier (Thousand Gallons per Day) | ||||||||
| Decade | Year-0 | Year-1 | Year-2 | Year-3 | Year-4 | Year-5 | Year-6 | Year-7 | Year-8 | Year-9 |
|---|---|---|---|---|---|---|---|---|---|---|
| 1980's | 7,746.3 | 7,200.2 | 7,266.6 | 7,173.1 | 6,337.9 | 6,848.6 | 10,481.0 | |||
| 1990's | 10,169.5 | 9,951.2 | 7,824.0 | 4,603.4 | 3,688.4 | 3,908.4 | 4,911.8 | 4,395.9 | 4,083.4 | 4,367.5 |
| 2000's | 4,302.6 | 4,408.6 | 3,870.3 | 3,386.4 | 3,525.9 | 3,812.4 | 5,582.6 | 5,691.8 | 5,007.1 | 5,577.2 |
| 2010's | 5,629.8 | 5,162.9 | 4,621.5 | 4,161.7 | 3,244.9 | 3,685.5 | 3,747.5 | W | W | 3,412.4 |
| 2020's | 1,149.8 |
| - = No Data Reported; -- = Not Applicable; NA = Not Available; W = Withheld to avoid disclosure of individual company data. |
| Release Date: 6/1/2022 |
| Next Release Date: TBD |