|
Download Data (XLS File) |
|
||||||||
|
||||||||
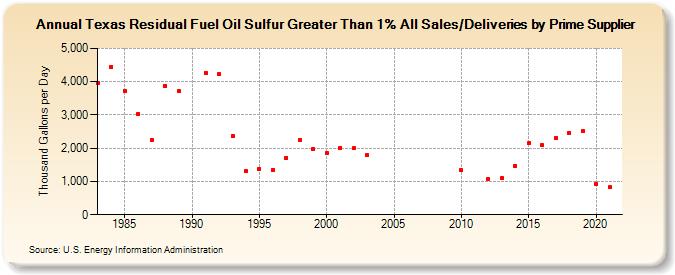
| Texas Residual Fuel Oil Sulfur Greater Than 1% All Sales/Deliveries by Prime Supplier (Thousand Gallons per Day) | ||||||||
| Decade | Year-0 | Year-1 | Year-2 | Year-3 | Year-4 | Year-5 | Year-6 | Year-7 | Year-8 | Year-9 |
|---|---|---|---|---|---|---|---|---|---|---|
| 1980's | 3,973.9 | 4,445.5 | 3,727.8 | 3,028.6 | 2,256.4 | 3,863.0 | 3,719.6 | |||
| 1990's | W | 4,274.9 | 4,216.9 | 2,366.8 | 1,307.8 | 1,379.1 | 1,354.3 | 1,719.4 | 2,260.4 | 1,970.8 |
| 2000's | 1,854.3 | 2,016.9 | 2,002.9 | 1,782.0 | W | W | W | W | W | W |
| 2010's | 1,333.3 | W | 1,072.5 | 1,096.6 | 1,474.8 | 2,146.3 | 2,085.5 | 2,303.1 | 2,470.7 | 2,508.1 |
| 2020's | 924.4 |
| - = No Data Reported; -- = Not Applicable; NA = Not Available; W = Withheld to avoid disclosure of individual company data. |
| Release Date: 6/1/2022 |
| Next Release Date: TBD |