|
Download Data (XLS File) |
|
||||||||
|
||||||||
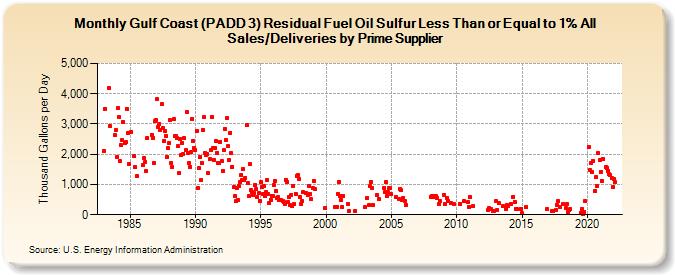
| Gulf Coast (PADD 3) Residual Fuel Oil Sulfur Less Than or Equal to 1% All Sales/Deliveries by Prime Supplier (Thousand Gallons per Day) | ||||||||
| Year | Jan | Feb | Mar | Apr | May | Jun | Jul | Aug | Sep | Oct | Nov | Dec |
|---|---|---|---|---|---|---|---|---|---|---|---|---|
| 1983 | 2,094.5 | 3,508.1 | W | W | W | 4,176.1 | 2,917.8 | W | W | W | 2,642.2 | 2,788.6 |
| 1984 | 1,908.4 | 3,518.6 | 3,220.5 | 1,764.2 | 2,301.5 | 2,461.2 | 3,062.6 | 2,379.7 | 2,387.9 | 3,497.8 | 2,707.1 | 1,682.2 |
| 1985 | W | 2,729.0 | W | W | 1,927.3 | 1,570.6 | 1,274.7 | W | W | W | W | W |
| 1986 | 1,640.8 | 1,864.7 | 1,755.1 | 1,447.9 | 2,535.6 | W | W | W | 2,648.7 | 2,545.8 | 1,715.5 | 3,098.9 |
| 1987 | 3,133.0 | 3,810.4 | 2,909.8 | 3,002.6 | 2,803.4 | 3,653.2 | 2,868.8 | 2,449.1 | 2,762.3 | 2,588.9 | 1,904.7 | 2,193.8 |
| 1988 | 2,355.5 | 3,119.0 | 1,716.3 | 1,575.9 | 3,156.0 | 2,589.1 | 2,595.9 | 2,529.4 | 2,261.4 | 1,373.1 | 2,507.9 | 1,980.5 |
| 1989 | 2,385.2 | 2,021.8 | 2,520.9 | 2,133.7 | 3,401.5 | 2,044.5 | 1,698.2 | 1,593.0 | 2,067.3 | 3,156.8 | 2,442.0 | 2,214.1 |
| 1990 | 2,131.5 | 2,753.2 | 881.0 | 1,533.8 | 1,906.5 | 1,147.4 | 1,716.3 | 2,809.1 | 3,217.1 | 2,038.5 | 1,974.6 | 1,995.8 |
| 1991 | 1,379.8 | 1,826.9 | 2,146.4 | 3,238.4 | 2,211.0 | 1,819.9 | 2,219.9 | 2,429.7 | 2,053.9 | 1,708.8 | 1,721.7 | 2,414.5 |
| 1992 | 1,764.7 | 1,461.6 | 2,127.2 | 2,848.4 | 2,468.0 | 3,184.0 | 2,270.2 | 1,816.0 | 2,712.8 | 2,030.9 | 1,590.9 | 915.0 |
| 1993 | 608.2 | 438.6 | 872.9 | 493.4 | 942.8 | 1,086.7 | 1,310.4 | 1,163.5 | 1,509.6 | 1,140.1 | 1,220.9 | 2,964.4 |
| 1994 | 1,048.4 | 607.8 | 1,660.8 | 805.9 | 736.5 | 648.5 | 715.8 | 985.1 | 843.1 | 578.3 | 715.7 | 462.9 |
| 1995 | 1,072.2 | 928.8 | 689.9 | 937.5 | 605.7 | 753.9 | 1,147.4 | 668.9 | 377.4 | 495.9 | 634.4 | 624.6 |
| 1996 | 978.4 | 1,099.5 | 791.6 | 543.1 | 584.1 | 495.4 | 494.4 | 474.5 | 463.0 | 425.7 | 370.6 | 1,148.4 |
| 1997 | 1,070.2 | 433.8 | 598.5 | 306.9 | 667.2 | 299.7 | 960.6 | 347.8 | 699.4 | 1,294.7 | 1,297.3 | 1,184.2 |
| 1998 | 580.0 | 344.6 | 461.8 | 736.0 | W | W | 713.7 | 664.0 | 938.8 | 693.7 | 509.3 | W |
| 1999 | 869.1 | 1,120.9 | 836.8 | W | W | W | W | W | W | W | W | 209.2 |
| 2000 | W | W | W | W | W | W | W | W | 257.3 | W | 265.0 | 695.5 |
| 2001 | 1,095.1 | 613.2 | 470.4 | 258.9 | 613.1 | W | W | W | 337.9 | 114.8 | W | W |
| 2002 | W | W | W | 123.3 | W | W | W | W | W | W | W | W |
| 2003 | 239.6 | W | 544.9 | 313.4 | 938.2 | 1,096.3 | 889.5 | 325.9 | W | W | W | 644.3 |
| 2004 | W | 505.6 | W | W | W | 896.1 | 740.9 | 1,073.1 | 624.5 | 748.0 | 877.0 | 873.5 |
| 2005 | 675.6 | W | W | W | 579.2 | W | W | 510.7 | 839.9 | 802.9 | 486.7 | 563.3 |
| 2006 | 455.8 | 327.4 | W | W | W | W | W | W | W | W | W | W |
| 2007 | W | W | W | W | W | W | W | W | W | W | W | W |
| 2008 | 600.0 | 611.3 | 619.0 | 598.3 | 591.4 | 606.9 | 559.3 | W | 366.5 | 437.0 | W | W |
| 2009 | 656.3 | 342.2 | W | 555.9 | 465.5 | W | W | 371.5 | W | 358.1 | W | W |
| 2010 | W | W | W | 365.2 | W | W | W | 442.2 | W | W | 406.2 | 271.4 |
| 2011 | 577.7 | W | W | 280.7 | W | W | W | W | W | W | W | W |
| 2012 | W | W | W | W | W | 152.5 | 206.8 | 185.7 | W | 137.3 | 134.8 | W |
| 2013 | 443.1 | 152.3 | W | 371.4 | W | W | 272.2 | W | W | 174.3 | 328.9 | 273.0 |
| 2014 | W | W | 358.4 | W | 596.4 | 435.7 | 204.1 | 176.1 | W | W | W | 201.6 |
| 2015 | 42.9 | W | W | W | 250.1 | W | W | W | W | W | W | W |
| 2016 | W | W | W | W | W | W | W | W | W | W | W | 185.3 |
| 2017 | W | W | W | 112.2 | 131.8 | W | W | 170.2 | 317.4 | 442.2 | W | 246.2 |
| 2018 | W | 344.1 | W | W | 216.1 | 338.0 | 73.3 | 155.6 | 184.9 | W | W | W |
| 2019 | W | W | W | W | W | W | 71.9 | 204.8 | 21.3 | 94.4 | 452.3 | W |
| 2020 | W | 2,246.8 | 1,492.9 | 1,711.0 | 1,419.6 | 1,772.0 | W | 780.4 | 1,233.2 | 933.3 | 2,026.5 | 1,795.8 |
| 2021 | 1,422.5 | 1,122.8 | 1,853.7 | W | W | 1,581.6 | 1,555.7 | 1,447.3 | 1,329.9 | 1,308.4 | 1,220.0 | 910.3 |
| 2022 | 1,187.2 | 1,068.0 | W | |||||||||
| - = No Data Reported; -- = Not Applicable; NA = Not Available; W = Withheld to avoid disclosure of individual company data. |
| Release Date: 5/19/2022 |
| Next Release Date: TBD |