|
Download Data (XLS File) |
|
||||||||
|
||||||||
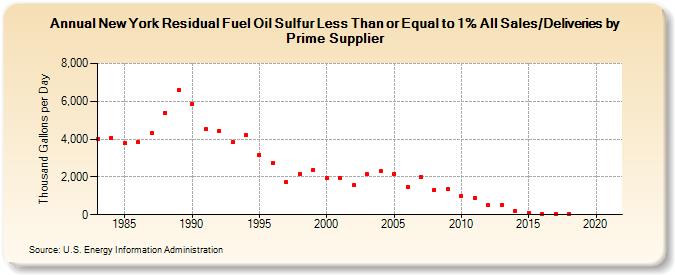
| New York Residual Fuel Oil Sulfur Less Than or Equal to 1% All Sales/Deliveries by Prime Supplier (Thousand Gallons per Day) | ||||||||
| Decade | Year-0 | Year-1 | Year-2 | Year-3 | Year-4 | Year-5 | Year-6 | Year-7 | Year-8 | Year-9 |
|---|---|---|---|---|---|---|---|---|---|---|
| 1980's | 3,997.3 | 4,082.5 | 3,787.6 | 3,828.4 | 4,335.2 | 5,403.0 | 6,597.8 | |||
| 1990's | 5,860.4 | 4,519.3 | 4,440.9 | 3,831.1 | 4,208.3 | 3,174.3 | 2,745.9 | 1,724.8 | 2,178.8 | 2,374.6 |
| 2000's | 1,955.4 | 1,950.3 | 1,565.8 | 2,133.0 | 2,302.7 | 2,178.0 | 1,478.3 | 1,995.5 | 1,317.0 | 1,370.3 |
| 2010's | 968.5 | 886.2 | 488.4 | 515.3 | 200.5 | 101.6 | 39.1 | 61.6 | 44.0 | W |
| 2020's | W |
| - = No Data Reported; -- = Not Applicable; NA = Not Available; W = Withheld to avoid disclosure of individual company data. |
| Release Date: 6/1/2022 |
| Next Release Date: TBD |