|
Download Data (XLS File) |
|
||||||||
|
||||||||
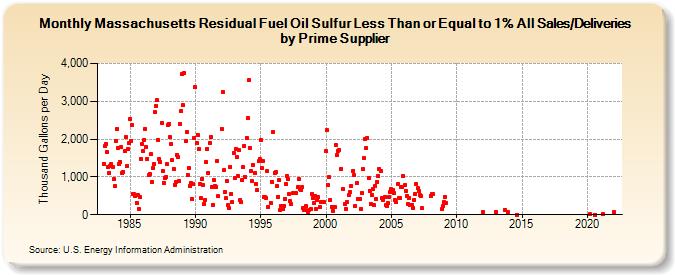
| Massachusetts Residual Fuel Oil Sulfur Less Than or Equal to 1% All Sales/Deliveries by Prime Supplier (Thousand Gallons per Day) | ||||||||
| Year | Jan | Feb | Mar | Apr | May | Jun | Jul | Aug | Sep | Oct | Nov | Dec |
|---|---|---|---|---|---|---|---|---|---|---|---|---|
| 1983 | 1,345.9 | 1,814.9 | 1,871.6 | 1,645.9 | 1,263.4 | 1,113.8 | 1,290.0 | 1,339.4 | 1,266.5 | 941.9 | 748.7 | 1,955.5 |
| 1984 | 2,269.9 | 1,765.6 | 1,342.4 | 1,404.1 | 1,777.9 | 1,101.5 | 1,136.1 | 1,681.6 | 2,051.8 | 1,278.9 | 1,726.4 | 1,891.0 |
| 1985 | 2,540.9 | 1,961.5 | 2,363.3 | 537.9 | 540.5 | 490.3 | 317.0 | 528.0 | 162.0 | 472.5 | 1,480.8 | 1,865.1 |
| 1986 | 1,690.2 | 1,976.8 | 2,272.5 | 1,797.2 | 1,486.1 | 1,043.6 | 1,077.4 | 1,594.6 | 875.4 | 1,230.5 | 1,344.6 | 2,715.5 |
| 1987 | 2,878.1 | 3,023.0 | 1,975.8 | 1,472.3 | 1,392.1 | 2,432.5 | 1,169.0 | 849.9 | 976.3 | 1,005.5 | 1,334.3 | 2,379.3 |
| 1988 | 2,407.1 | 2,045.0 | 1,870.9 | 1,438.6 | 1,215.0 | 795.3 | 853.1 | 1,581.7 | 1,517.2 | 898.2 | 2,396.9 | 2,751.4 |
| 1989 | 3,719.9 | 2,894.5 | 3,747.0 | 1,939.6 | 2,181.8 | 1,045.4 | 1,232.7 | 769.0 | 844.2 | 410.5 | 801.7 | 2,039.3 |
| 1990 | 3,367.8 | 1,903.6 | 2,109.9 | 1,727.9 | 811.6 | 441.0 | 952.0 | 782.7 | 271.5 | 400.1 | 1,398.1 | 1,738.9 |
| 1991 | 1,113.3 | 1,902.1 | 2,054.6 | 742.5 | 263.9 | 919.0 | 766.1 | 745.3 | 1,422.1 | 487.3 | W | W |
| 1992 | 2,279.3 | 3,238.4 | 1,172.5 | 606.4 | 433.0 | 888.1 | 244.1 | 170.5 | 1,271.2 | 549.7 | 335.4 | 1,626.9 |
| 1993 | 967.7 | 1,747.6 | 1,523.8 | 1,026.0 | 1,707.5 | 392.2 | 324.6 | 915.2 | 1,252.3 | 1,827.9 | 995.4 | 2,039.8 |
| 1994 | 2,552.8 | 3,553.2 | 1,775.6 | 1,147.3 | 883.9 | 1,323.4 | W | 1,105.0 | 810.0 | 646.4 | 1,411.4 | 1,474.2 |
| 1995 | 1,971.0 | 1,238.6 | 1,408.8 | 473.1 | 464.4 | 438.7 | 1,150.6 | 216.5 | W | 319.3 | 872.6 | 2,184.9 |
| 1996 | W | 1,115.2 | 1,120.5 | 759.2 | 477.4 | 911.3 | 136.5 | 230.7 | 155.3 | 228.4 | 424.5 | 820.5 |
| 1997 | 1,021.4 | 942.2 | 547.5 | 358.7 | 273.5 | W | 570.6 | W | 566.9 | W | 727.1 | 949.5 |
| 1998 | 686.4 | 652.0 | 725.1 | 168.7 | 117.4 | 111.8 | 217.3 | 73.8 | 114.0 | W | 145.2 | 558.5 |
| 1999 | 451.9 | 308.4 | 504.1 | 154.6 | 384.4 | 460.1 | 214.8 | 330.9 | W | W | 342.4 | NA |
| 2000 | 1,672.2 | 2,231.8 | 789.8 | 992.2 | 396.3 | 216.6 | 107.3 | 191.4 | 203.3 | 1,845.9 | 1,567.5 | 1,685.0 |
| 2001 | 1,713.0 | W | 1,214.7 | W | 674.2 | 285.9 | 157.5 | 333.7 | W | 509.7 | 590.5 | 772.2 |
| 2002 | W | 1,162.6 | 1,042.8 | 240.2 | 827.3 | 426.3 | W | 409.1 | 155.5 | 575.0 | 1,210.7 | 1,492.3 |
| 2003 | 2,002.7 | 1,761.1 | 2,035.3 | 966.0 | 639.1 | 284.6 | 517.1 | 672.3 | 246.7 | 760.5 | 424.7 | 874.1 |
| 2004 | 1,011.3 | 1,210.4 | 1,162.9 | 447.5 | 390.3 | W | 471.6 | 245.9 | 232.0 | 299.4 | 466.4 | 604.8 |
| 2005 | 673.0 | 666.3 | 565.4 | 389.6 | 332.3 | W | 822.8 | 436.3 | 440.6 | 740.0 | 742.6 | 1,022.2 |
| 2006 | 775.1 | 627.4 | 503.7 | 270.8 | 454.3 | 256.8 | W | 265.4 | 169.0 | 400.3 | 553.1 | 813.1 |
| 2007 | 699.4 | 626.4 | 523.5 | 500.5 | 170.8 | W | W | W | W | W | W | W |
| 2008 | 506.5 | 552.8 | 539.6 | W | W | W | W | W | W | W | 138.5 | 222.4 |
| 2009 | 335.9 | 478.2 | 321.8 | W | W | W | W | W | W | W | W | W |
| 2010 | W | W | W | W | W | W | W | W | W | W | W | W |
| 2011 | W | W | W | W | W | W | W | W | W | W | W | W |
| 2012 | 82.2 | W | W | W | W | W | W | W | W | W | W | W |
| 2013 | 75.1 | W | W | W | W | W | W | W | 133.6 | W | W | 76.8 |
| 2014 | W | W | W | W | W | W | W | 4.0 | W | W | W | W |
| 2015 | W | W | W | W | W | W | W | W | W | W | W | W |
| 2016 | W | W | W | W | W | W | W | W | W | W | W | W |
| 2017 | W | W | W | W | W | W | W | W | W | W | W | W |
| 2018 | W | W | W | W | W | W | W | W | W | W | W | W |
| 2019 | W | W | W | W | W | W | W | W | W | W | W | W |
| 2020 | W | W | 9.1 | W | W | W | W | 3.1 | W | W | W | W |
| 2021 | W | W | 6.5 | W | W | W | W | W | W | W | W | W |
| 2022 | 63.0 | W | W | |||||||||
| - = No Data Reported; -- = Not Applicable; NA = Not Available; W = Withheld to avoid disclosure of individual company data. |
| Release Date: 5/19/2022 |
| Next Release Date: TBD |