|
Download Data (XLS File) |
|
||||||||
|
||||||||
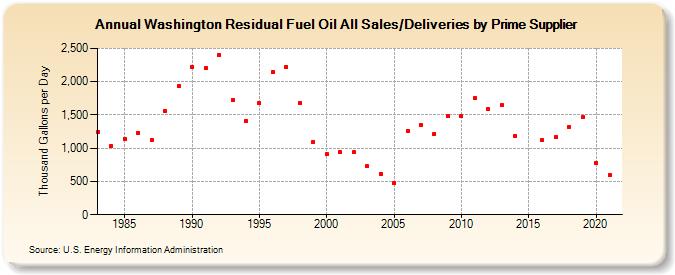
| Washington Residual Fuel Oil All Sales/Deliveries by Prime Supplier (Thousand Gallons per Day) | ||||||||
| Decade | Year-0 | Year-1 | Year-2 | Year-3 | Year-4 | Year-5 | Year-6 | Year-7 | Year-8 | Year-9 |
|---|---|---|---|---|---|---|---|---|---|---|
| 1980's | 1,245.3 | 1,034.1 | 1,140.5 | 1,234.9 | 1,129.5 | 1,557.6 | 1,934.2 | |||
| 1990's | 2,222.3 | 2,208.5 | 2,407.3 | 1,723.5 | 1,412.2 | 1,672.1 | 2,144.6 | 2,223.3 | 1,678.0 | 1,089.7 |
| 2000's | 906.8 | 938.2 | 937.3 | 727.0 | 615.0 | 476.6 | 1,264.3 | 1,351.4 | 1,218.9 | 1,481.0 |
| 2010's | 1,484.7 | 1,748.4 | 1,583.6 | 1,648.0 | 1,186.3 | W | 1,122.0 | 1,165.8 | 1,323.6 | 1,464.0 |
| 2020's | 777.9 |
| - = No Data Reported; -- = Not Applicable; NA = Not Available; W = Withheld to avoid disclosure of individual company data. |
| Release Date: 6/1/2022 |
| Next Release Date: TBD |