|
Download Data (XLS File) |
|
||||||||
|
||||||||
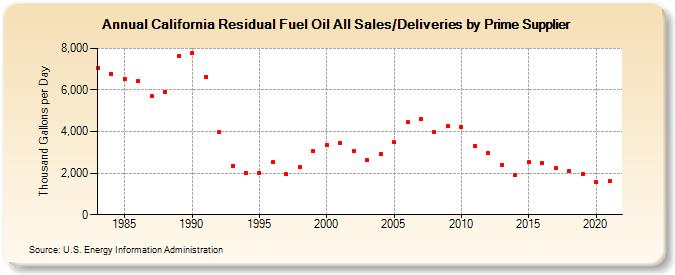
| California Residual Fuel Oil All Sales/Deliveries by Prime Supplier (Thousand Gallons per Day) | ||||||||
| Decade | Year-0 | Year-1 | Year-2 | Year-3 | Year-4 | Year-5 | Year-6 | Year-7 | Year-8 | Year-9 |
|---|---|---|---|---|---|---|---|---|---|---|
| 1980's | 7,042.0 | 6,778.2 | 6,551.0 | 6,450.6 | 5,691.2 | 5,909.6 | 7,637.3 | |||
| 1990's | 7,788.3 | 6,613.5 | 3,961.6 | 2,349.9 | 2,023.9 | 1,999.8 | 2,517.0 | 1,945.9 | 2,301.0 | 3,057.0 |
| 2000's | 3,358.4 | 3,450.7 | 3,050.7 | 2,609.6 | 2,939.6 | 3,477.0 | 4,444.6 | 4,603.8 | 3,989.7 | 4,258.2 |
| 2010's | 4,216.7 | 3,328.8 | 2,964.6 | 2,397.3 | 1,891.5 | 2,523.1 | 2,479.3 | 2,239.1 | 2,107.8 | 1,980.9 |
| 2020's | 1,570.0 |
| - = No Data Reported; -- = Not Applicable; NA = Not Available; W = Withheld to avoid disclosure of individual company data. |
| Release Date: 6/1/2022 |
| Next Release Date: TBD |