|
Download Data (XLS File) |
|
||||||||
|
||||||||
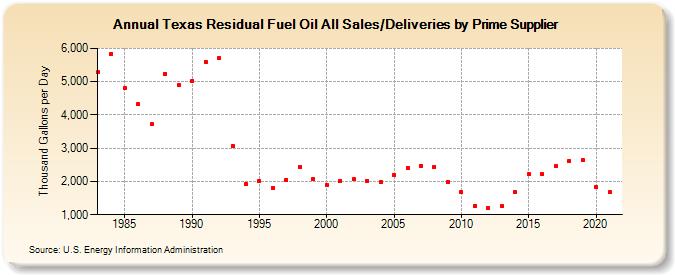
| Texas Residual Fuel Oil All Sales/Deliveries by Prime Supplier (Thousand Gallons per Day) | ||||||||
| Decade | Year-0 | Year-1 | Year-2 | Year-3 | Year-4 | Year-5 | Year-6 | Year-7 | Year-8 | Year-9 |
|---|---|---|---|---|---|---|---|---|---|---|
| 1980's | 5,282.8 | 5,832.4 | 4,814.5 | 4,316.3 | 3,716.1 | 5,245.1 | 4,905.0 | |||
| 1990's | 5,022.4 | 5,604.8 | 5,702.6 | 3,072.0 | 1,935.6 | 2,007.5 | 1,812.1 | 2,055.2 | 2,444.4 | 2,070.0 |
| 2000's | 1,907.0 | 2,027.5 | 2,062.1 | 2,018.0 | 1,976.2 | 2,191.7 | 2,404.5 | 2,479.0 | 2,442.0 | 1,986.8 |
| 2010's | 1,679.2 | 1,261.0 | 1,187.8 | 1,265.1 | 1,672.6 | 2,216.5 | 2,226.4 | 2,454.3 | 2,617.2 | 2,640.7 |
| 2020's | 1,824.0 |
| - = No Data Reported; -- = Not Applicable; NA = Not Available; W = Withheld to avoid disclosure of individual company data. |
| Release Date: 6/1/2022 |
| Next Release Date: TBD |