|
Download Data (XLS File) |
|
||||||||
|
||||||||
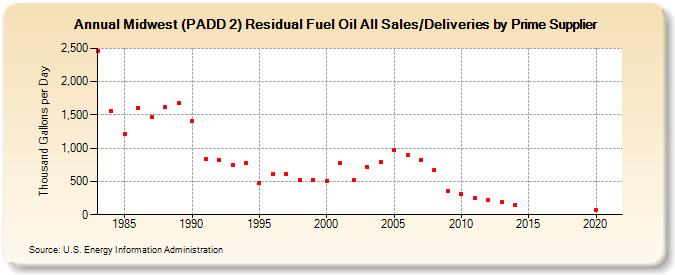
| Midwest (PADD 2) Residual Fuel Oil All Sales/Deliveries by Prime Supplier (Thousand Gallons per Day) | ||||||||
| Decade | Year-0 | Year-1 | Year-2 | Year-3 | Year-4 | Year-5 | Year-6 | Year-7 | Year-8 | Year-9 |
|---|---|---|---|---|---|---|---|---|---|---|
| 1980's | 2,453.5 | 1,562.3 | 1,206.3 | 1,610.7 | 1,461.3 | 1,612.5 | 1,676.6 | |||
| 1990's | 1,411.6 | 837.9 | 818.6 | 743.1 | 769.8 | 481.4 | 619.1 | 608.2 | 516.1 | 528.5 |
| 2000's | 502.2 | 784.6 | 519.3 | 717.6 | 798.4 | 978.6 | 903.9 | 828.5 | 670.9 | 355.9 |
| 2010's | 310.6 | 245.0 | 225.6 | 192.6 | 149.4 | W | W | W | W | W |
| 2020's | 73.2 |
| - = No Data Reported; -- = Not Applicable; NA = Not Available; W = Withheld to avoid disclosure of individual company data. |
| Release Date: 6/1/2022 |
| Next Release Date: TBD |