|
Download Data (XLS File) |
|
||||||||
|
||||||||
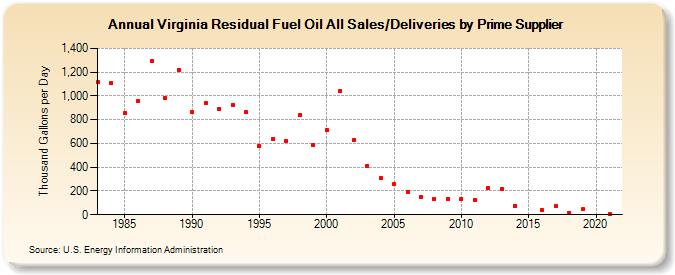
| Virginia Residual Fuel Oil All Sales/Deliveries by Prime Supplier (Thousand Gallons per Day) | ||||||||
| Decade | Year-0 | Year-1 | Year-2 | Year-3 | Year-4 | Year-5 | Year-6 | Year-7 | Year-8 | Year-9 |
|---|---|---|---|---|---|---|---|---|---|---|
| 1980's | 1,112.9 | 1,107.1 | 854.5 | 954.9 | 1,295.0 | 981.4 | 1,220.2 | |||
| 1990's | 861.1 | 940.2 | 893.2 | 927.2 | 863.4 | 580.7 | 638.0 | 621.6 | 840.2 | 582.8 |
| 2000's | 714.3 | 1,040.0 | 628.5 | 412.6 | 311.3 | 260.6 | 191.4 | 150.8 | 135.7 | 132.7 |
| 2010's | 133.0 | 125.2 | 223.5 | 216.4 | 72.5 | W | 39.0 | 70.0 | 13.8 | 45.9 |
| 2020's | W |
| - = No Data Reported; -- = Not Applicable; NA = Not Available; W = Withheld to avoid disclosure of individual company data. |
| Release Date: 6/1/2022 |
| Next Release Date: TBD |