|
Download Data (XLS File) |
|
||||||||
|
||||||||
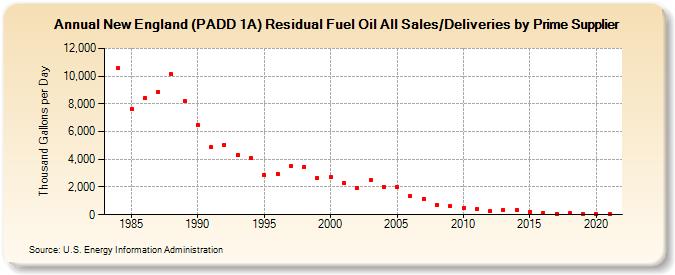
| New England (PADD 1A) Residual Fuel Oil All Sales/Deliveries by Prime Supplier (Thousand Gallons per Day) | ||||||||
| Decade | Year-0 | Year-1 | Year-2 | Year-3 | Year-4 | Year-5 | Year-6 | Year-7 | Year-8 | Year-9 |
|---|---|---|---|---|---|---|---|---|---|---|
| 1980's | W | 10,559.2 | 7,641.8 | 8,413.1 | 8,870.1 | 10,126.6 | 8,189.1 | |||
| 1990's | 6,504.9 | 4,867.4 | 5,061.7 | 4,301.9 | 4,115.1 | 2,885.5 | 2,961.5 | 3,488.4 | 3,443.3 | 2,648.4 |
| 2000's | 2,732.3 | 2,279.1 | 1,956.2 | 2,527.7 | 2,010.9 | 2,016.4 | 1,325.7 | 1,137.4 | 721.0 | 601.9 |
| 2010's | 480.7 | 413.4 | 241.0 | 342.4 | 363.1 | 202.2 | 114.0 | 72.5 | 95.6 | 69.6 |
| 2020's | 50.7 |
| - = No Data Reported; -- = Not Applicable; NA = Not Available; W = Withheld to avoid disclosure of individual company data. |
| Release Date: 6/1/2022 |
| Next Release Date: TBD |