|
Download Data (XLS File) |
|
||||||||
|
||||||||
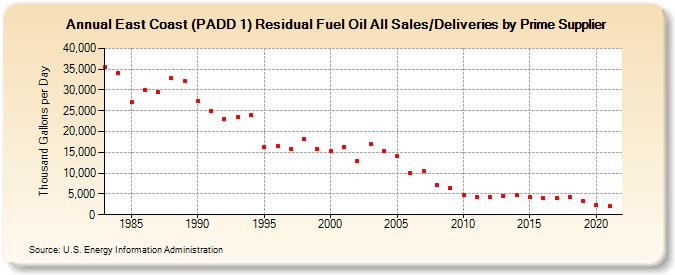
| East Coast (PADD 1) Residual Fuel Oil All Sales/Deliveries by Prime Supplier (Thousand Gallons per Day) | ||||||||
| Decade | Year-0 | Year-1 | Year-2 | Year-3 | Year-4 | Year-5 | Year-6 | Year-7 | Year-8 | Year-9 |
|---|---|---|---|---|---|---|---|---|---|---|
| 1980's | 35,625.6 | 34,142.3 | 27,087.9 | 30,037.4 | 29,441.0 | 32,809.7 | 32,100.2 | |||
| 1990's | 27,262.9 | 24,895.9 | 23,081.9 | 23,536.2 | 24,020.5 | 16,259.8 | 16,606.0 | 15,781.7 | 18,102.3 | 15,848.1 |
| 2000's | 15,208.1 | 16,290.5 | 12,985.2 | 16,959.5 | 15,222.6 | 14,142.4 | 10,039.7 | 10,622.6 | 7,032.8 | 6,416.4 |
| 2010's | 4,859.7 | 4,347.1 | 4,378.9 | 4,563.6 | 4,787.8 | 4,192.2 | 4,093.7 | 3,971.6 | 4,336.0 | 3,231.7 |
| 2020's | 2,219.2 |
| - = No Data Reported; -- = Not Applicable; NA = Not Available; W = Withheld to avoid disclosure of individual company data. |
| Release Date: 6/1/2022 |
| Next Release Date: TBD |