|
Download Data (XLS File) |
|
||||||||
|
||||||||
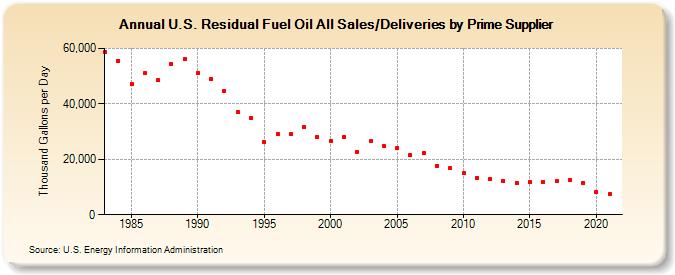
| U.S. Residual Fuel Oil All Sales/Deliveries by Prime Supplier (Thousand Gallons per Day) | ||||||||
| Decade | Year-0 | Year-1 | Year-2 | Year-3 | Year-4 | Year-5 | Year-6 | Year-7 | Year-8 | Year-9 |
|---|---|---|---|---|---|---|---|---|---|---|
| 1980's | 58,703.2 | 55,551.1 | 47,239.9 | 51,062.9 | 48,592.3 | 54,498.4 | 56,127.2 | |||
| 1990's | 51,169.8 | 48,920.3 | 44,582.4 | 37,135.9 | 34,939.5 | 26,364.0 | 29,067.3 | 28,995.1 | 31,543.5 | 28,105.5 |
| 2000's | 26,666.1 | 28,179.2 | 22,627.7 | 26,452.7 | 24,799.2 | 24,004.3 | 21,487.7 | 22,286.3 | 17,699.8 | 16,787.3 |
| 2010's | 15,086.3 | 13,334.6 | 12,935.9 | 12,138.3 | 11,555.4 | 11,884.7 | 11,933.4 | 11,990.9 | 12,614.0 | 11,504.5 |
| 2020's | 8,232.4 |
| - = No Data Reported; -- = Not Applicable; NA = Not Available; W = Withheld to avoid disclosure of individual company data. |
| Release Date: 6/1/2022 |
| Next Release Date: TBD |