|
Download Data (XLS File) |
|
||||||||
|
||||||||
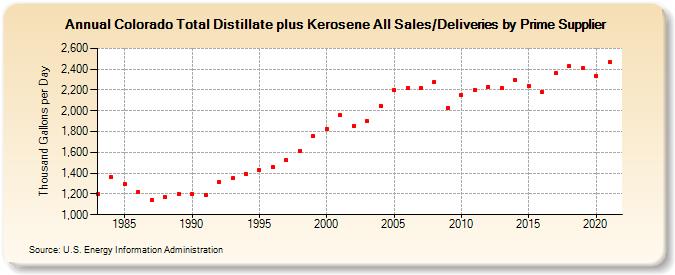
| Colorado Total Distillate plus Kerosene All Sales/Deliveries by Prime Supplier (Thousand Gallons per Day) | ||||||||
| Decade | Year-0 | Year-1 | Year-2 | Year-3 | Year-4 | Year-5 | Year-6 | Year-7 | Year-8 | Year-9 |
|---|---|---|---|---|---|---|---|---|---|---|
| 1980's | 1,199.7 | 1,362.1 | 1,292.6 | 1,218.7 | 1,142.9 | 1,166.6 | 1,200.4 | |||
| 1990's | 1,200.2 | 1,189.3 | 1,311.9 | 1,350.2 | 1,394.5 | 1,431.2 | 1,460.5 | 1,525.2 | 1,615.6 | 1,754.8 |
| 2000's | 1,827.5 | 1,958.3 | 1,855.6 | 1,900.4 | 2,046.8 | 2,196.2 | 2,215.4 | 2,214.6 | 2,280.4 | 2,026.6 |
| 2010's | 2,152.8 | 2,204.2 | 2,229.8 | 2,219.8 | 2,299.1 | 2,241.3 | 2,182.8 | 2,359.2 | 2,429.5 | 2,408.1 |
| 2020's | 2,336.1 |
| - = No Data Reported; -- = Not Applicable; NA = Not Available; W = Withheld to avoid disclosure of individual company data. |
| Release Date: 6/1/2022 |
| Next Release Date: TBD |