|
Download Data (XLS File) |
|
||||||||
|
||||||||
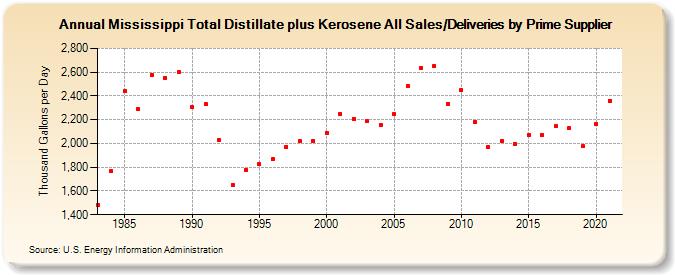
| Mississippi Total Distillate plus Kerosene All Sales/Deliveries by Prime Supplier (Thousand Gallons per Day) | ||||||||
| Decade | Year-0 | Year-1 | Year-2 | Year-3 | Year-4 | Year-5 | Year-6 | Year-7 | Year-8 | Year-9 |
|---|---|---|---|---|---|---|---|---|---|---|
| 1980's | 1,484.5 | 1,765.0 | 2,439.5 | 2,288.2 | 2,579.6 | 2,554.6 | 2,603.7 | |||
| 1990's | 2,303.6 | 2,330.6 | 2,029.1 | 1,652.4 | 1,779.0 | 1,825.3 | 1,867.2 | 1,972.3 | 2,016.3 | 2,020.7 |
| 2000's | 2,088.1 | 2,247.4 | 2,208.4 | 2,187.4 | 2,156.9 | 2,247.6 | 2,484.2 | 2,637.9 | 2,652.4 | 2,335.7 |
| 2010's | 2,451.5 | 2,183.1 | 1,966.8 | 2,024.1 | 1,994.1 | 2,075.1 | 2,074.1 | 2,144.6 | 2,125.9 | 1,974.7 |
| 2020's | 2,163.3 |
| - = No Data Reported; -- = Not Applicable; NA = Not Available; W = Withheld to avoid disclosure of individual company data. |
| Release Date: 6/1/2022 |
| Next Release Date: TBD |