|
Download Data (XLS File) |
|
||||||||
|
||||||||
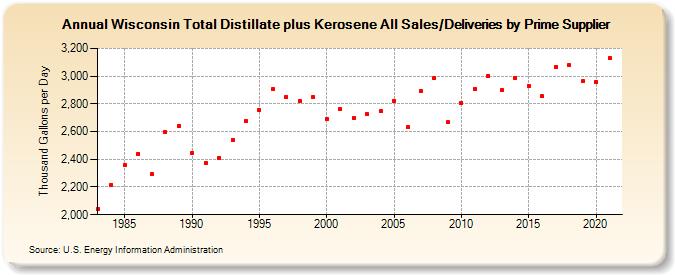
| Wisconsin Total Distillate plus Kerosene All Sales/Deliveries by Prime Supplier (Thousand Gallons per Day) | ||||||||
| Decade | Year-0 | Year-1 | Year-2 | Year-3 | Year-4 | Year-5 | Year-6 | Year-7 | Year-8 | Year-9 |
|---|---|---|---|---|---|---|---|---|---|---|
| 1980's | 2,041.3 | 2,217.9 | 2,358.8 | 2,441.0 | 2,290.3 | 2,595.3 | 2,639.3 | |||
| 1990's | 2,446.4 | 2,375.3 | 2,411.7 | 2,541.1 | 2,675.2 | 2,754.3 | 2,906.5 | 2,849.7 | 2,820.3 | 2,849.2 |
| 2000's | 2,691.7 | 2,761.3 | 2,699.7 | 2,725.4 | 2,744.7 | 2,824.0 | 2,630.5 | 2,895.3 | 2,984.1 | 2,668.1 |
| 2010's | 2,807.4 | 2,908.0 | 3,003.1 | 2,900.5 | 2,989.9 | 2,930.1 | 2,852.9 | 3,068.4 | 3,079.1 | 2,962.3 |
| 2020's | 2,960.7 |
| - = No Data Reported; -- = Not Applicable; NA = Not Available; W = Withheld to avoid disclosure of individual company data. |
| Release Date: 6/1/2022 |
| Next Release Date: TBD |