|
Download Data (XLS File) |
|
||||||||
|
||||||||
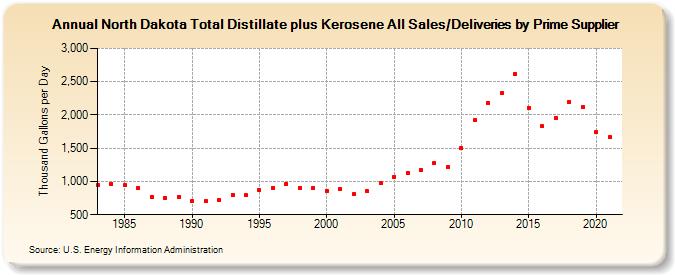
| North Dakota Total Distillate plus Kerosene All Sales/Deliveries by Prime Supplier (Thousand Gallons per Day) | ||||||||
| Decade | Year-0 | Year-1 | Year-2 | Year-3 | Year-4 | Year-5 | Year-6 | Year-7 | Year-8 | Year-9 |
|---|---|---|---|---|---|---|---|---|---|---|
| 1980's | 947.9 | 967.5 | 941.7 | 908.2 | 772.0 | 748.0 | 771.4 | |||
| 1990's | 702.2 | 704.9 | 717.5 | 803.5 | 789.1 | 867.2 | 902.2 | 965.6 | 901.9 | 903.8 |
| 2000's | 861.6 | 889.3 | 809.0 | 851.2 | 977.0 | 1,072.2 | 1,128.6 | 1,171.3 | 1,273.9 | 1,211.4 |
| 2010's | 1,499.8 | 1,917.2 | 2,176.9 | 2,329.4 | 2,613.2 | 2,111.0 | 1,829.0 | 1,958.8 | 2,194.7 | 2,118.6 |
| 2020's | 1,738.1 |
| - = No Data Reported; -- = Not Applicable; NA = Not Available; W = Withheld to avoid disclosure of individual company data. |
| Release Date: 6/1/2022 |
| Next Release Date: TBD |