|
Download Data (XLS File) |
|
||||||||
|
||||||||
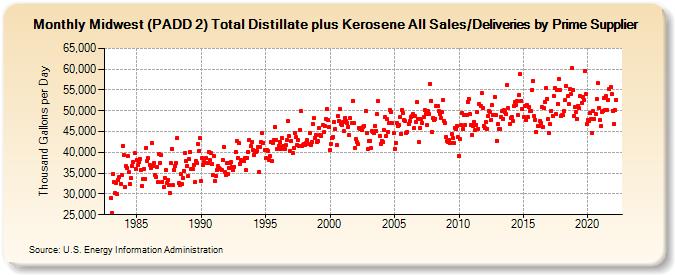
| Midwest (PADD 2) Total Distillate plus Kerosene All Sales/Deliveries by Prime Supplier (Thousand Gallons per Day) | ||||||||
| Year | Jan | Feb | Mar | Apr | May | Jun | Jul | Aug | Sep | Oct | Nov | Dec |
|---|---|---|---|---|---|---|---|---|---|---|---|---|
| 1983 | 28,924.8 | 25,316.8 | 34,812.4 | 32,861.4 | 30,186.3 | 32,702.0 | 29,872.8 | 33,337.8 | 34,071.1 | 32,502.7 | 34,575.3 | 41,475.5 |
| 1984 | 39,472.8 | 31,685.4 | 36,615.3 | 36,226.4 | 39,106.6 | 35,187.6 | 32,332.6 | 33,791.8 | 36,682.7 | 37,636.0 | 39,727.7 | 35,902.5 |
| 1985 | 38,159.5 | 36,851.1 | 37,576.6 | 38,451.0 | 35,819.2 | 31,974.6 | 33,507.2 | 35,996.5 | 33,619.8 | 41,112.8 | 37,899.5 | 38,559.4 |
| 1986 | 37,027.6 | 36,129.2 | 42,195.2 | 36,783.2 | 37,552.1 | 34,657.5 | 34,123.1 | 36,464.1 | 32,774.9 | 39,504.3 | 37,454.3 | 39,250.2 |
| 1987 | 32,874.5 | 31,712.6 | 33,927.6 | 35,706.8 | 32,613.5 | 33,289.6 | 32,135.1 | 30,183.9 | 37,372.1 | 40,918.0 | 32,044.7 | 35,837.5 |
| 1988 | 36,711.2 | 37,408.3 | 43,408.3 | 32,573.4 | 32,251.3 | 34,691.3 | 32,280.1 | 33,867.0 | 35,627.4 | 39,925.3 | 37,994.6 | 36,819.2 |
| 1989 | 34,339.1 | 38,281.9 | 40,136.7 | 35,925.8 | 35,881.4 | 37,060.5 | 32,902.1 | 38,037.4 | 37,369.9 | 41,964.0 | 40,420.1 | 43,440.3 |
| 1990 | 33,013.4 | 38,529.4 | 37,060.2 | 37,731.9 | 37,376.6 | 38,598.7 | 37,494.2 | 40,167.1 | 38,106.0 | 39,832.8 | 37,178.1 | 34,463.2 |
| 1991 | 39,163.2 | 33,043.4 | 34,295.2 | 35,846.0 | 36,673.2 | 36,221.1 | 36,030.7 | 35,653.7 | 38,237.6 | 41,285.5 | 35,302.2 | 34,628.0 |
| 1992 | 37,516.0 | 34,857.1 | 36,328.5 | 37,365.2 | 37,688.7 | 36,531.6 | 35,765.1 | 36,590.3 | 40,159.6 | 42,841.8 | 38,644.1 | 42,145.3 |
| 1993 | 37,237.5 | 38,086.1 | 37,799.7 | 37,934.1 | 37,957.7 | 38,707.2 | 35,694.1 | 38,755.3 | 40,099.8 | 43,008.0 | 41,452.4 | 42,539.2 |
| 1994 | 40,515.0 | 39,477.4 | 40,243.1 | 40,101.9 | 40,249.3 | 41,333.2 | 35,301.7 | 41,379.5 | 42,599.3 | 44,610.0 | 42,258.0 | 40,460.7 |
| 1995 | 38,572.7 | 40,472.0 | 40,427.6 | 38,232.9 | 39,027.3 | 42,454.5 | 37,831.0 | 42,352.7 | 42,988.5 | 46,097.1 | 42,965.7 | 40,863.1 |
| 1996 | 41,550.8 | 42,535.3 | 40,808.4 | 43,510.3 | 41,422.2 | 41,363.7 | 40,724.9 | 41,664.4 | 43,010.2 | 47,441.1 | 43,843.7 | 40,427.6 |
| 1997 | 42,789.8 | 39,819.8 | 40,973.6 | 44,704.8 | 43,605.5 | 41,733.7 | 42,916.8 | 41,420.4 | 45,446.0 | 49,929.2 | 41,644.6 | 41,765.6 |
| 1998 | 42,114.6 | 41,784.3 | 42,212.3 | 42,872.0 | 41,897.8 | 44,716.4 | 41,882.7 | 42,577.2 | 46,841.7 | 48,158.7 | 43,506.8 | 44,171.1 |
| 1999 | 42,455.5 | 42,648.0 | 45,902.7 | 44,123.1 | 44,010.6 | 46,516.6 | 44,774.2 | 46,451.3 | 48,054.5 | 50,413.3 | 47,725.0 | 46,069.7 |
| 2000 | 40,483.3 | 42,018.3 | 43,526.3 | 43,674.4 | 47,302.5 | 45,550.4 | 41,764.5 | 48,634.7 | 47,588.5 | 50,481.7 | 46,774.0 | 46,572.6 |
| 2001 | 47,392.1 | 45,088.9 | 48,379.0 | 47,487.8 | 47,015.0 | 46,202.1 | 44,179.0 | 48,165.0 | 47,002.3 | 52,372.1 | 47,126.9 | 41,108.5 |
| 2002 | 43,109.5 | 42,607.1 | 41,939.2 | 45,936.8 | 45,621.6 | 45,850.9 | 45,416.5 | 46,157.8 | 46,432.6 | 49,903.2 | 44,655.7 | 40,777.3 |
| 2003 | 42,649.5 | 42,730.6 | 41,134.2 | 45,013.3 | 44,950.4 | 44,672.2 | 46,357.9 | 45,046.6 | 49,117.5 | 52,246.6 | 44,032.0 | 42,073.8 |
| 2004 | 42,774.6 | 42,493.7 | 45,368.6 | 48,435.7 | 43,846.3 | 47,979.8 | 44,959.4 | 47,045.6 | 50,122.5 | 49,624.8 | 46,946.0 | 44,558.9 |
| 2005 | 40,789.1 | 42,332.0 | 47,062.8 | 46,265.2 | 46,616.6 | 48,567.8 | 44,474.8 | 50,065.5 | 49,364.5 | 47,740.6 | 47,436.4 | 44,611.6 |
| 2006 | 44,916.4 | 46,852.4 | 47,453.8 | 48,422.6 | 48,662.3 | 49,203.7 | 45,751.6 | 48,670.1 | 47,307.9 | 52,009.8 | 48,008.5 | 42,373.8 |
| 2007 | 45,943.9 | 47,917.5 | 47,113.4 | 48,393.3 | 50,122.5 | 49,326.3 | 46,568.6 | 49,951.7 | 49,337.8 | 56,453.9 | 52,438.8 | 44,951.5 |
| 2008 | 48,221.5 | 47,767.8 | 48,071.2 | 51,150.1 | 51,179.8 | 49,839.8 | 49,171.6 | 48,240.0 | 49,732.7 | 52,545.0 | 47,503.0 | 47,011.0 |
| 2009 | 43,702.8 | 42,617.2 | 42,446.2 | 42,873.1 | 42,323.4 | 44,397.2 | 43,470.4 | 42,327.5 | 45,968.5 | 45,730.7 | 46,216.6 | 43,628.6 |
| 2010 | 39,219.7 | 43,168.1 | 46,492.1 | 49,501.8 | 45,654.1 | 48,937.8 | 46,550.7 | 48,866.0 | 52,222.4 | 52,876.6 | 49,134.2 | 46,578.0 |
| 2011 | 44,198.6 | 46,288.0 | 47,371.0 | 45,326.3 | 46,656.2 | 49,598.1 | 45,727.1 | 51,617.8 | 51,234.7 | 54,156.0 | 50,777.8 | 46,373.3 |
| 2012 | 45,943.4 | 47,354.9 | 45,697.5 | 48,646.9 | 49,922.4 | 49,731.3 | 47,796.1 | 51,312.2 | 49,060.6 | 53,338.2 | 48,907.0 | 42,792.2 |
| 2013 | 46,771.5 | 45,608.1 | 45,505.5 | 48,509.1 | 49,931.7 | 48,091.2 | 50,117.1 | 49,693.2 | 49,128.2 | 56,194.6 | 50,610.2 | 46,800.1 |
| 2014 | 48,270.7 | 48,612.5 | 47,557.6 | 51,112.8 | 52,161.5 | 51,450.5 | 52,308.8 | 48,899.1 | 53,694.5 | 58,814.8 | 52,433.9 | 50,348.9 |
| 2015 | 48,526.9 | 51,199.2 | 47,849.1 | 51,303.7 | 48,483.0 | 50,896.7 | 49,965.2 | 50,009.2 | 55,066.0 | 57,089.9 | 48,631.1 | 47,887.7 |
| 2016 | 44,809.9 | 46,275.8 | 46,251.9 | 47,524.7 | 47,049.5 | 50,871.1 | 46,018.8 | 50,603.8 | 52,178.9 | 55,429.8 | 52,920.7 | 47,995.9 |
| 2017 | 44,680.7 | 46,715.9 | 50,038.5 | 48,813.7 | 53,629.1 | 55,440.8 | 49,218.2 | 55,000.1 | 51,684.9 | 57,655.1 | 55,036.4 | 48,831.7 |
| 2018 | 48,897.6 | 49,005.7 | 49,862.6 | 52,623.4 | 55,964.3 | 53,459.6 | 51,506.3 | 55,188.7 | 53,998.6 | 60,247.2 | 55,105.7 | 48,783.3 |
| 2019 | 50,915.9 | 49,647.3 | 47,993.5 | 51,236.4 | 50,581.7 | 53,485.2 | 51,939.4 | 53,241.2 | 52,659.3 | 59,661.4 | 53,982.8 | 46,786.8 |
| 2020 | 47,778.1 | 47,610.8 | 49,416.9 | 47,986.0 | 44,754.3 | 49,874.3 | 48,134.1 | 49,160.5 | 52,829.8 | 56,594.5 | 50,728.0 | 47,767.9 |
| 2021 | 46,325.5 | 49,659.7 | 49,932.9 | 53,061.5 | 50,074.8 | 53,502.4 | 50,108.8 | 52,574.7 | 55,169.4 | 55,666.5 | 54,068.7 | 50,020.5 |
| 2022 | 46,866.1 | 50,187.9 | 52,592.0 | |||||||||
| - = No Data Reported; -- = Not Applicable; NA = Not Available; W = Withheld to avoid disclosure of individual company data. |
| Release Date: 5/19/2022 |
| Next Release Date: TBD |