|
Download Data (XLS File) |
|
||||||||
|
||||||||
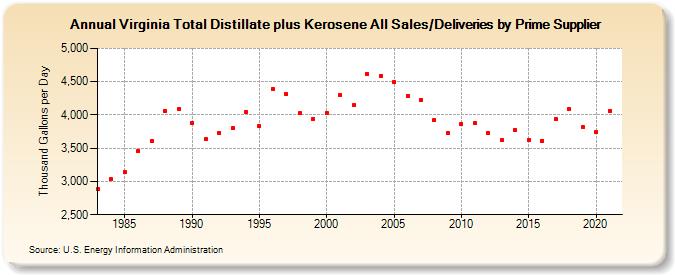
| Virginia Total Distillate plus Kerosene All Sales/Deliveries by Prime Supplier (Thousand Gallons per Day) | ||||||||
| Decade | Year-0 | Year-1 | Year-2 | Year-3 | Year-4 | Year-5 | Year-6 | Year-7 | Year-8 | Year-9 |
|---|---|---|---|---|---|---|---|---|---|---|
| 1980's | 2,885.2 | 3,032.3 | 3,139.2 | 3,465.0 | 3,613.1 | 4,055.5 | 4,091.9 | |||
| 1990's | 3,877.8 | 3,633.3 | 3,730.9 | 3,801.3 | 4,046.6 | 3,830.3 | 4,392.5 | 4,315.2 | 4,021.6 | 3,941.3 |
| 2000's | 4,034.7 | 4,301.7 | 4,148.6 | 4,617.8 | 4,589.2 | 4,490.2 | 4,289.6 | 4,231.1 | 3,926.4 | 3,729.5 |
| 2010's | 3,863.0 | 3,881.2 | 3,725.4 | 3,616.6 | 3,774.1 | 3,622.9 | 3,613.0 | 3,939.6 | 4,085.1 | 3,812.9 |
| 2020's | 3,740.6 |
| - = No Data Reported; -- = Not Applicable; NA = Not Available; W = Withheld to avoid disclosure of individual company data. |
| Release Date: 6/1/2022 |
| Next Release Date: TBD |