|
Download Data (XLS File) |
|
||||||||
|
||||||||
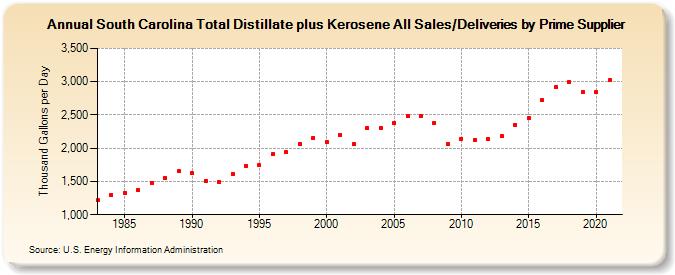
| South Carolina Total Distillate plus Kerosene All Sales/Deliveries by Prime Supplier (Thousand Gallons per Day) | ||||||||
| Decade | Year-0 | Year-1 | Year-2 | Year-3 | Year-4 | Year-5 | Year-6 | Year-7 | Year-8 | Year-9 |
|---|---|---|---|---|---|---|---|---|---|---|
| 1980's | 1,216.3 | 1,297.7 | 1,328.0 | 1,370.9 | 1,483.7 | 1,549.4 | 1,657.0 | |||
| 1990's | 1,623.8 | 1,512.6 | 1,494.3 | 1,612.2 | 1,737.4 | 1,740.9 | 1,909.0 | 1,939.6 | 2,064.5 | 2,156.1 |
| 2000's | 2,098.3 | 2,203.5 | 2,065.8 | 2,303.7 | 2,306.7 | 2,377.0 | 2,482.1 | 2,479.0 | 2,383.7 | 2,056.3 |
| 2010's | 2,141.9 | 2,123.4 | 2,130.9 | 2,185.4 | 2,354.5 | 2,457.2 | 2,721.4 | 2,915.3 | 2,991.9 | 2,837.0 |
| 2020's | 2,838.7 |
| - = No Data Reported; -- = Not Applicable; NA = Not Available; W = Withheld to avoid disclosure of individual company data. |
| Release Date: 6/1/2022 |
| Next Release Date: TBD |