|
Download Data (XLS File) |
|
||||||||
|
||||||||
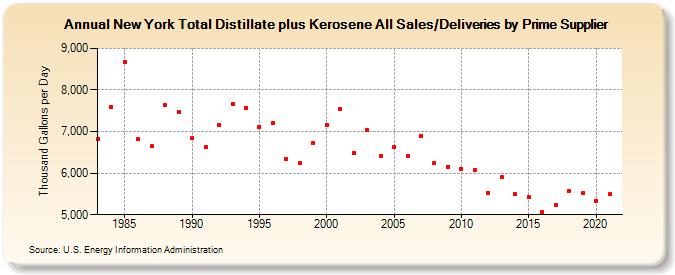
| New York Total Distillate plus Kerosene All Sales/Deliveries by Prime Supplier (Thousand Gallons per Day) | ||||||||
| Decade | Year-0 | Year-1 | Year-2 | Year-3 | Year-4 | Year-5 | Year-6 | Year-7 | Year-8 | Year-9 |
|---|---|---|---|---|---|---|---|---|---|---|
| 1980's | 6,819.3 | 7,593.4 | 8,676.1 | 6,815.9 | 6,651.0 | 7,632.1 | 7,460.3 | |||
| 1990's | 6,839.6 | 6,633.9 | 7,146.6 | 7,670.1 | 7,563.4 | 7,105.1 | 7,199.1 | 6,339.5 | 6,254.1 | 6,718.2 |
| 2000's | 7,156.2 | 7,532.2 | 6,495.4 | 7,030.6 | 6,407.5 | 6,633.6 | 6,415.7 | 6,891.3 | 6,247.4 | 6,151.7 |
| 2010's | 6,105.5 | 6,078.9 | 5,512.9 | 5,898.0 | 5,495.3 | 5,433.6 | 5,071.7 | 5,227.2 | 5,572.0 | 5,530.5 |
| 2020's | 5,341.2 |
| - = No Data Reported; -- = Not Applicable; NA = Not Available; W = Withheld to avoid disclosure of individual company data. |
| Release Date: 6/1/2022 |
| Next Release Date: TBD |