|
Download Data (XLS File) |
|
||||||||
|
||||||||
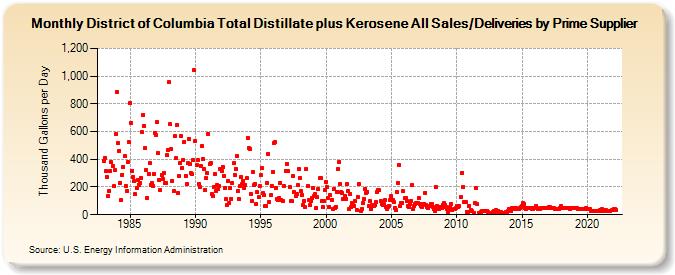
| District of Columbia Total Distillate plus Kerosene All Sales/Deliveries by Prime Supplier (Thousand Gallons per Day) | ||||||||
| Year | Jan | Feb | Mar | Apr | May | Jun | Jul | Aug | Sep | Oct | Nov | Dec |
|---|---|---|---|---|---|---|---|---|---|---|---|---|
| 1983 | 387.7 | 410.0 | 314.9 | 274.7 | 131.6 | 171.6 | 314.5 | 378.1 | 353.5 | 204.6 | 320.1 | 581.6 |
| 1984 | 886.8 | 516.1 | 462.0 | 230.8 | 106.9 | 288.7 | 346.7 | 420.6 | 207.5 | 171.5 | 382.5 | 525.6 |
| 1985 | 805.9 | 664.4 | 318.4 | 272.4 | 241.1 | 147.1 | 191.0 | 247.3 | 216.6 | 229.7 | 267.3 | 594.2 |
| 1986 | 722.0 | 642.2 | 479.5 | 322.8 | 119.6 | 294.6 | 372.4 | 217.2 | 230.2 | 210.7 | 294.1 | 590.3 |
| 1987 | 572.5 | 666.4 | 445.1 | 252.4 | 178.4 | 290.1 | 260.9 | 302.2 | 226.0 | 229.3 | 427.7 | 464.4 |
| 1988 | 954.2 | 651.6 | 475.9 | 245.6 | 170.2 | 564.8 | 406.3 | 647.6 | 157.0 | 280.0 | 374.7 | 565.2 |
| 1989 | 339.9 | 396.6 | 527.9 | 281.2 | 220.4 | 369.8 | 548.4 | 365.9 | 298.8 | 293.1 | 395.5 | 1,042.4 |
| 1990 | 532.1 | 356.2 | 392.6 | 225.0 | 197.6 | 353.2 | 495.4 | 400.5 | 328.3 | 180.7 | 264.8 | 299.8 |
| 1991 | 584.1 | 365.2 | 375.3 | 148.9 | 132.8 | 201.9 | 296.7 | 173.9 | 217.7 | 183.1 | 206.2 | 331.8 |
| 1992 | 314.5 | 346.6 | 282.3 | 193.9 | 111.3 | 68.2 | 245.5 | 86.4 | 190.2 | 115.0 | 229.7 | 370.3 |
| 1993 | 288.4 | 333.1 | 422.8 | 173.3 | 111.8 | 203.8 | 272.9 | 224.7 | 245.9 | 193.9 | 214.6 | 263.8 |
| 1994 | 556.8 | 480.8 | 476.5 | 149.9 | 97.3 | 308.5 | 211.9 | 224.1 | 75.7 | 160.5 | 125.2 | 206.1 |
| 1995 | 283.3 | 335.5 | 153.4 | 138.8 | 61.0 | 64.9 | 229.3 | 439.4 | 94.4 | 139.2 | 206.5 | 308.6 |
| 1996 | 515.8 | 522.9 | 194.4 | 115.9 | 105.9 | 117.8 | 231.7 | 106.0 | 96.3 | 207.8 | NA | 318.9 |
| 1997 | 367.4 | 311.8 | NA | 203.4 | 100.0 | 95.5 | 278.7 | 163.7 | 133.2 | 149.6 | 212.0 | 327.2 |
| 1998 | 261.8 | 168.0 | 140.6 | 71.6 | 102.0 | 52.7 | 329.4 | 205.5 | 104.3 | 70.7 | 100.8 | 117.2 |
| 1999 | 189.8 | 135.6 | 151.1 | 50.7 | 125.4 | 183.2 | 263.0 | 266.3 | 99.2 | 55.8 | 99.0 | 176.6 |
| 2000 | 239.5 | 201.9 | 123.8 | 59.0 | 141.1 | 105.0 | 43.7 | 183.6 | 45.3 | 58.6 | 166.4 | 331.5 |
| 2001 | 382.7 | 220.7 | 161.7 | 157.2 | 111.4 | 137.8 | 113.4 | 220.1 | 170.4 | 41.2 | 150.2 | 57.2 |
| 2002 | 81.2 | 68.5 | 64.9 | 95.5 | 36.4 | 129.9 | 222.9 | W | 28.4 | 41.5 | 85.9 | 112.2 |
| 2003 | 188.1 | 157.3 | 162.7 | 63.0 | 96.8 | 39.1 | 66.9 | 63.8 | 59.4 | 69.5 | 92.9 | 163.4 |
| 2004 | 181.7 | 175.0 | 102.3 | 75.3 | 72.2 | 77.8 | 104.5 | 58.0 | 39.7 | 55.8 | 65.0 | 106.3 |
| 2005 | 133.0 | 104.5 | 91.6 | 48.5 | 36.6 | 162.0 | 230.5 | 358.0 | 61.7 | 87.9 | 87.7 | 169.2 |
| 2006 | 119.8 | 122.2 | 95.5 | 63.2 | 54.4 | 78.7 | 102.0 | 214.9 | 44.4 | 61.3 | 74.7 | 82.6 |
| 2007 | 82.8 | 121.1 | 75.4 | 63.3 | 56.2 | 80.2 | 79.4 | 160.2 | 69.4 | 52.2 | 46.6 | 62.7 |
| 2008 | 76.5 | 76.2 | 54.5 | 39.8 | 27.5 | 198.6 | 65.5 | 48.8 | 42.9 | 55.3 | 45.7 | 68.0 |
| 2009 | 81.6 | 67.9 | 54.0 | 41.4 | 23.0 | 40.5 | 53.5 | 78.5 | 33.7 | 40.9 | 40.1 | 45.5 |
| 2010 | 62.5 | 58.9 | 59.5 | NA | 126.2 | 303.0 | 202.2 | 89.3 | 89.9 | 22.2 | 20.1 | 61.6 |
| 2011 | NA | 36.4 | 23.2 | NA | 14.5 | 81.7 | 194.5 | 74.5 | 13.0 | 14.6 | 22.9 | 24.9 |
| 2012 | 28.7 | 26.5 | 24.4 | 28.8 | 29.5 | 18.5 | 14.8 | 15.4 | 14.8 | 19.2 | 25.2 | 22.2 |
| 2013 | 31.0 | 28.7 | 26.2 | 21.3 | 14.2 | 17.1 | 13.3 | 12.4 | 12.0 | 16.2 | 21.7 | 26.8 |
| 2014 | 44.3 | 39.5 | 26.9 | 46.6 | 39.0 | 50.3 | 47.6 | 42.4 | 44.5 | 40.7 | 50.8 | 53.4 |
| 2015 | 65.8 | 83.7 | 77.1 | 45.0 | 42.0 | 48.7 | 47.9 | 47.1 | 47.8 | 44.4 | 44.4 | 47.3 |
| 2016 | 48.9 | 61.4 | 45.8 | 43.4 | 43.9 | 45.2 | 45.5 | 51.8 | 45.2 | 45.6 | 46.5 | 51.5 |
| 2017 | 51.0 | 52.6 | 53.7 | 47.0 | 47.2 | 46.6 | 44.6 | 42.6 | 42.8 | 41.9 | 43.8 | 49.1 |
| 2018 | 59.3 | 51.3 | 46.0 | 47.8 | 45.5 | 47.4 | 45.8 | 48.8 | 41.6 | 46.4 | 46.8 | 48.4 |
| 2019 | 49.0 | 49.3 | 45.4 | 42.9 | 43.4 | 39.2 | 41.6 | 43.0 | 37.7 | 42.2 | 40.5 | 49.0 |
| 2020 | 42.3 | 43.9 | 39.3 | 26.4 | 25.4 | 29.2 | 27.7 | 27.8 | 29.0 | 26.5 | 26.8 | 32.0 |
| 2021 | 29.6 | 38.0 | 31.9 | 26.9 | 25.0 | 31.8 | 28.9 | 29.3 | 29.8 | 27.9 | 31.4 | 34.4 |
| 2022 | 38.9 | 38.2 | 37.6 | |||||||||
| - = No Data Reported; -- = Not Applicable; NA = Not Available; W = Withheld to avoid disclosure of individual company data. |
| Release Date: 5/19/2022 |
| Next Release Date: TBD |