|
Download Data (XLS File) |
|
||||||||
|
||||||||
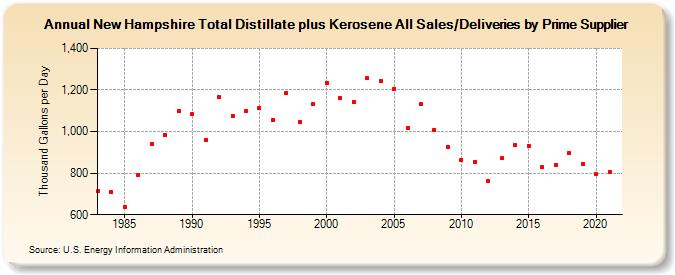
| New Hampshire Total Distillate plus Kerosene All Sales/Deliveries by Prime Supplier (Thousand Gallons per Day) | ||||||||
| Decade | Year-0 | Year-1 | Year-2 | Year-3 | Year-4 | Year-5 | Year-6 | Year-7 | Year-8 | Year-9 |
|---|---|---|---|---|---|---|---|---|---|---|
| 1980's | 711.8 | 708.9 | 636.8 | 791.8 | 941.8 | 984.5 | 1,098.0 | |||
| 1990's | 1,086.0 | 959.4 | 1,165.2 | 1,076.4 | 1,098.6 | 1,113.8 | 1,057.2 | 1,185.5 | 1,047.2 | 1,131.1 |
| 2000's | 1,235.4 | 1,162.6 | 1,143.0 | 1,256.4 | 1,243.2 | 1,206.0 | 1,018.4 | 1,131.0 | 1,009.5 | 926.1 |
| 2010's | 865.2 | 852.7 | 762.8 | 871.2 | 936.5 | 932.4 | 828.9 | 839.6 | 897.5 | 843.8 |
| 2020's | 794.1 |
| - = No Data Reported; -- = Not Applicable; NA = Not Available; W = Withheld to avoid disclosure of individual company data. |
| Release Date: 6/1/2022 |
| Next Release Date: TBD |