|
Download Data (XLS File) |
|
||||||||
|
||||||||
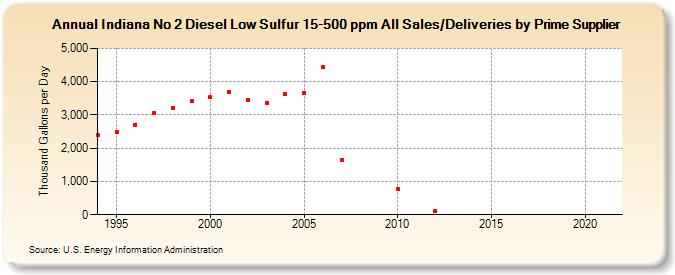
| Indiana No 2 Diesel Low Sulfur 15-500 ppm All Sales/Deliveries by Prime Supplier (Thousand Gallons per Day) | ||||||||
| Decade | Year-0 | Year-1 | Year-2 | Year-3 | Year-4 | Year-5 | Year-6 | Year-7 | Year-8 | Year-9 |
|---|---|---|---|---|---|---|---|---|---|---|
| 1990's | 2,405.1 | 2,481.4 | 2,708.0 | 3,057.4 | 3,221.2 | 3,418.5 | ||||
| 2000's | 3,526.1 | 3,703.4 | 3,443.4 | 3,361.1 | 3,624.0 | 3,669.5 | 4,452.0 | 1,633.7 | W | W |
| 2010's | 773.6 | W | 116.6 | W | W | - | - | - | - | - |
| 2020's | - |
| - = No Data Reported; -- = Not Applicable; NA = Not Available; W = Withheld to avoid disclosure of individual company data. |
| Release Date: 6/1/2022 |
| Next Release Date: TBD |