|
Download Data (XLS File) |
|
||||||||
|
||||||||
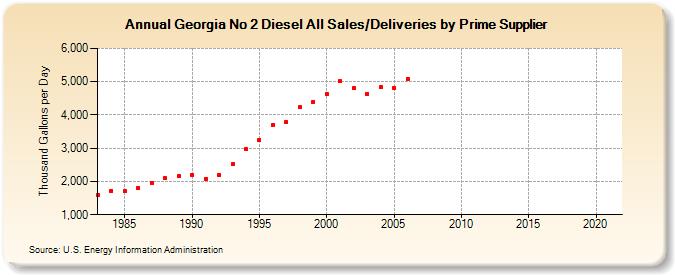
| Georgia No 2 Diesel All Sales/Deliveries by Prime Supplier (Thousand Gallons per Day) | ||||||||
| Decade | Year-0 | Year-1 | Year-2 | Year-3 | Year-4 | Year-5 | Year-6 | Year-7 | Year-8 | Year-9 |
|---|---|---|---|---|---|---|---|---|---|---|
| 1980's | 1,586.0 | 1,724.2 | 1,698.4 | 1,808.9 | 1,965.5 | 2,095.3 | 2,149.3 | |||
| 1990's | 2,182.6 | 2,079.3 | 2,188.3 | 2,510.5 | 2,967.1 | 3,251.7 | 3,700.7 | 3,788.0 | 4,226.0 | 4,395.4 |
| 2000's | 4,640.8 | 5,017.6 | 4,815.0 | 4,642.1 | 4,842.9 | 4,817.3 | 5,091.4 | NA | NA | NA |
| 2010's | NA | NA | NA | NA | NA | NA | NA | NA | NA | NA |
| 2020's | NA |
| - = No Data Reported; -- = Not Applicable; NA = Not Available; W = Withheld to avoid disclosure of individual company data. |
| Release Date: 6/1/2022 |
| Next Release Date: TBD |