|
Download Data (XLS File) |
|
||||||||
|
||||||||
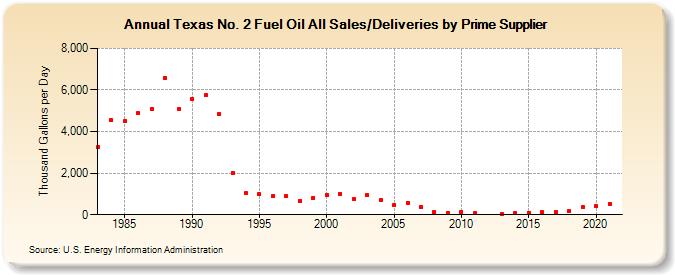
| Texas No. 2 Fuel Oil All Sales/Deliveries by Prime Supplier (Thousand Gallons per Day) | ||||||||
| Decade | Year-0 | Year-1 | Year-2 | Year-3 | Year-4 | Year-5 | Year-6 | Year-7 | Year-8 | Year-9 |
|---|---|---|---|---|---|---|---|---|---|---|
| 1980's | 3,242.9 | 4,543.0 | 4,485.2 | 4,875.8 | 5,102.6 | 6,570.4 | 5,088.7 | |||
| 1990's | 5,572.0 | 5,744.5 | 4,824.8 | 2,011.6 | 1,022.6 | 987.8 | 879.8 | 883.7 | 675.4 | 817.7 |
| 2000's | 962.3 | 1,016.2 | 749.6 | 927.6 | 690.1 | 465.2 | 580.7 | 367.0 | 135.6 | 86.6 |
| 2010's | 135.4 | 77.6 | W | 50.2 | 94.0 | 103.6 | 112.7 | 153.0 | 170.8 | 353.4 |
| 2020's | 400.6 |
| - = No Data Reported; -- = Not Applicable; NA = Not Available; W = Withheld to avoid disclosure of individual company data. |
| Release Date: 6/1/2022 |
| Next Release Date: TBD |