|
Download Data (XLS File) |
|
||||||||
|
||||||||
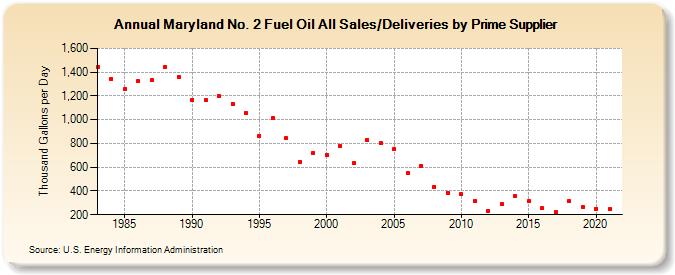
| Maryland No. 2 Fuel Oil All Sales/Deliveries by Prime Supplier (Thousand Gallons per Day) | ||||||||
| Decade | Year-0 | Year-1 | Year-2 | Year-3 | Year-4 | Year-5 | Year-6 | Year-7 | Year-8 | Year-9 |
|---|---|---|---|---|---|---|---|---|---|---|
| 1980's | 1,445.4 | 1,346.4 | 1,255.4 | 1,321.9 | 1,330.1 | 1,446.4 | 1,358.3 | |||
| 1990's | 1,169.4 | 1,161.6 | 1,196.4 | 1,134.2 | 1,057.7 | 866.6 | 1,011.9 | 841.6 | 645.4 | 721.6 |
| 2000's | 705.5 | 777.0 | 635.9 | 828.2 | 799.6 | 751.0 | 549.9 | 608.4 | 437.2 | 385.8 |
| 2010's | 371.7 | 314.8 | 235.1 | 290.0 | 353.4 | 311.3 | 255.3 | 219.8 | 312.5 | 265.8 |
| 2020's | 252.3 |
| - = No Data Reported; -- = Not Applicable; NA = Not Available; W = Withheld to avoid disclosure of individual company data. |
| Release Date: 6/1/2022 |
| Next Release Date: TBD |