|
Download Data (XLS File) |
|
||||||||
|
||||||||
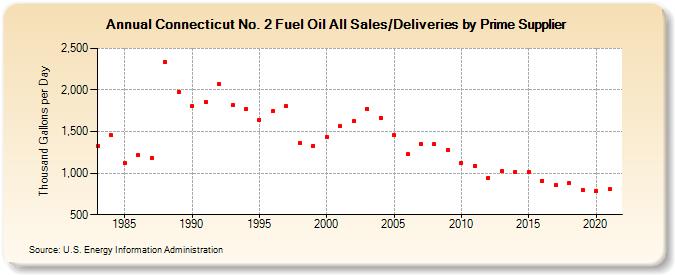
| Connecticut No. 2 Fuel Oil All Sales/Deliveries by Prime Supplier (Thousand Gallons per Day) | ||||||||
| Decade | Year-0 | Year-1 | Year-2 | Year-3 | Year-4 | Year-5 | Year-6 | Year-7 | Year-8 | Year-9 |
|---|---|---|---|---|---|---|---|---|---|---|
| 1980's | 1,331.7 | 1,454.2 | 1,117.2 | 1,215.3 | 1,185.6 | 2,337.6 | 1,978.0 | |||
| 1990's | 1,810.0 | 1,858.3 | 2,066.7 | 1,816.4 | 1,770.2 | 1,642.9 | 1,742.0 | 1,801.7 | 1,360.6 | 1,328.0 |
| 2000's | 1,435.8 | 1,563.4 | 1,621.0 | 1,776.8 | 1,668.6 | 1,453.9 | 1,225.9 | 1,355.6 | 1,346.4 | 1,282.9 |
| 2010's | 1,122.7 | 1,088.2 | 942.3 | 1,021.4 | 1,019.4 | 1,014.1 | 909.4 | 859.0 | 878.0 | 802.6 |
| 2020's | 782.7 |
| - = No Data Reported; -- = Not Applicable; NA = Not Available; W = Withheld to avoid disclosure of individual company data. |
| Release Date: 6/1/2022 |
| Next Release Date: TBD |