|
Download Data (XLS File) |
|
||||||||
|
||||||||
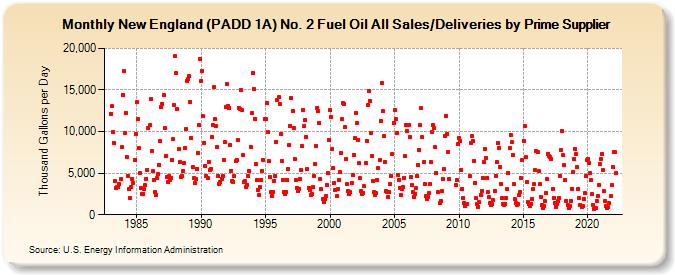
| New England (PADD 1A) No. 2 Fuel Oil All Sales/Deliveries by Prime Supplier (Thousand Gallons per Day) | ||||||||
| Year | Jan | Feb | Mar | Apr | May | Jun | Jul | Aug | Sep | Oct | Nov | Dec |
|---|---|---|---|---|---|---|---|---|---|---|---|---|
| 1983 | 12,147.6 | 13,031.3 | 9,983.0 | 8,638.2 | 4,012.3 | 3,213.1 | 3,303.9 | 3,305.8 | 3,676.3 | 4,254.4 | 8,106.0 | 14,426.7 |
| 1984 | 17,272.7 | 9,783.3 | 12,234.8 | 6,883.8 | 4,704.4 | 3,045.7 | 2,051.6 | 3,376.7 | 4,271.1 | 3,873.0 | 6,548.9 | 9,705.8 |
| 1985 | 13,504.8 | 11,464.0 | 8,049.5 | 4,958.9 | 3,155.2 | 2,488.4 | 2,542.7 | 3,058.1 | 3,536.1 | 4,324.4 | 5,378.5 | 10,393.4 |
| 1986 | 10,738.7 | 13,898.5 | 7,619.0 | 5,211.6 | 4,181.8 | 2,706.0 | 2,335.3 | 4,434.4 | 4,894.9 | 6,027.3 | 8,842.1 | 12,913.3 |
| 1987 | 13,333.8 | 14,386.2 | 10,455.7 | 7,056.6 | 4,538.3 | 3,875.6 | 4,665.1 | 4,161.8 | 4,450.9 | 6,551.7 | 9,062.4 | 13,216.5 |
| 1988 | 19,071.0 | 17,034.5 | 12,671.2 | 7,865.0 | 6,363.1 | 4,547.0 | 4,629.9 | 5,300.7 | 6,227.6 | 8,043.2 | 10,282.6 | 16,052.6 |
| 1989 | 16,261.3 | 16,634.0 | 13,604.3 | 9,234.6 | 5,700.8 | 4,362.8 | 3,771.2 | 4,318.3 | 5,534.2 | 7,465.5 | 10,728.6 | 18,756.5 |
| 1990 | 16,126.5 | 17,297.8 | 11,833.0 | 8,643.8 | 5,857.5 | 4,677.0 | 4,399.0 | 6,383.4 | 5,327.5 | 5,554.9 | 9,287.8 | 10,786.4 |
| 1991 | 15,316.2 | 11,523.9 | 10,696.2 | 8,102.0 | 4,628.4 | 3,662.3 | 3,912.5 | 4,285.8 | 4,642.3 | 6,638.0 | 8,697.1 | 12,899.3 |
| 1992 | 15,697.2 | 13,124.3 | 12,886.5 | 8,377.4 | 5,268.0 | 4,105.1 | 3,971.6 | 4,680.1 | 6,440.5 | 6,597.8 | 8,974.4 | 12,832.9 |
| 1993 | 12,746.6 | 15,034.5 | 12,640.6 | 7,193.0 | 3,927.6 | 4,005.0 | 3,349.3 | 3,526.0 | 4,633.8 | 5,284.8 | 8,166.2 | 12,198.1 |
| 1994 | 16,999.6 | 15,140.5 | 11,562.6 | 6,080.0 | 4,154.6 | 3,029.7 | 2,420.1 | 3,272.7 | 4,216.2 | 5,313.0 | 6,610.0 | 11,484.1 |
| 1995 | 11,549.6 | 13,416.5 | 9,902.0 | 6,437.7 | 4,526.3 | 2,677.4 | 2,291.1 | 2,673.9 | 4,080.0 | 4,691.2 | 8,791.1 | 13,798.5 |
| 1996 | 14,099.7 | 13,303.1 | 9,729.9 | 6,476.5 | 4,213.8 | 2,789.3 | 2,475.0 | 2,768.2 | 4,169.7 | 5,469.6 | 8,358.1 | 10,724.7 |
| 1997 | 14,028.7 | 12,418.7 | 10,463.9 | 6,756.5 | 4,143.9 | 3,225.8 | 2,812.4 | 3,137.9 | 4,263.5 | 5,328.4 | 8,259.2 | 12,639.3 |
| 1998 | 10,720.2 | 11,344.4 | 9,371.5 | 5,446.4 | 3,242.5 | 3,002.6 | 2,358.4 | 2,533.0 | 3,380.9 | 4,658.4 | 6,153.0 | 8,275.9 |
| 1999 | 12,841.5 | 12,436.7 | 11,023.7 | 4,335.2 | 3,053.2 | 1,890.6 | 1,562.8 | 1,830.4 | 2,229.0 | 3,624.6 | 5,020.4 | 9,016.5 |
| 2000 | 12,563.8 | 11,720.9 | 7,849.8 | 5,654.2 | 3,825.9 | 2,918.0 | 2,194.9 | 3,044.5 | 4,209.8 | 5,107.7 | 7,395.5 | 11,476.0 |
| 2001 | 13,450.7 | 13,264.5 | 10,501.6 | 6,724.2 | 3,639.7 | 2,806.3 | 2,490.2 | 2,725.9 | 3,828.8 | 4,746.4 | 7,187.3 | 9,189.2 |
| 2002 | 12,279.1 | 11,086.8 | 9,028.1 | 6,235.5 | 4,405.5 | 2,854.1 | 2,491.2 | 2,603.5 | 3,446.5 | 6,204.8 | 8,911.7 | 13,143.2 |
| 2003 | 14,931.3 | 13,722.3 | 9,808.9 | 7,019.5 | 4,029.5 | 2,720.7 | 2,426.8 | 2,603.4 | 4,191.9 | 5,595.4 | 6,577.4 | 11,314.9 |
| 2004 | 15,879.8 | 12,414.2 | 9,524.6 | 6,364.9 | 2,849.1 | 2,684.1 | 2,105.9 | 2,731.2 | 3,646.5 | 4,681.4 | 7,269.3 | 11,068.1 |
| 2005 | 12,596.0 | 11,453.3 | 9,854.2 | 4,754.7 | 4,161.0 | 3,204.4 | 2,343.4 | 3,090.9 | 3,386.8 | 4,465.1 | 7,033.6 | 10,770.8 |
| 2006 | 10,050.2 | 10,756.2 | 9,381.2 | 4,517.6 | 3,583.3 | 2,683.6 | 2,164.0 | 2,542.3 | 3,204.8 | 4,646.3 | 6,011.4 | 7,829.6 |
| 2007 | 10,750.3 | 12,868.2 | 9,307.2 | 6,345.4 | 3,673.7 | 2,211.3 | 1,900.7 | 2,152.9 | 2,605.1 | 3,645.2 | 6,310.3 | 9,978.5 |
| 2008 | 10,753.0 | 10,372.0 | 8,104.3 | 4,994.5 | 2,677.0 | W | 1,431.4 | 1,619.5 | 2,809.3 | 4,311.5 | 5,507.9 | 9,501.5 |
| 2009 | 11,895.2 | 9,742.2 | 7,570.9 | 4,274.9 | W | W | W | W | W | 3,563.6 | 4,126.3 | 8,525.8 |
| 2010 | 9,214.4 | 8,858.5 | 5,431.4 | 3,126.5 | 1,988.5 | 1,380.3 | 1,047.1 | 1,333.3 | NA | NA | 4,689.8 | 8,650.4 |
| 2011 | 9,443.0 | 8,886.0 | 6,503.8 | 3,798.8 | 1,964.0 | 1,281.2 | 970.0 | 1,476.5 | 2,320.4 | 2,846.2 | 4,463.4 | 6,292.4 |
| 2012 | 7,907.5 | 6,866.9 | 4,434.3 | 2,748.0 | 2,091.2 | 1,384.3 | 1,122.0 | 1,312.4 | 1,714.7 | 2,860.1 | 4,690.0 | 6,329.6 |
| 2013 | 8,675.3 | 8,025.3 | 5,771.3 | 3,750.6 | 1,963.1 | 1,259.7 | 1,187.0 | 1,311.7 | 2,007.2 | 3,051.1 | 5,028.3 | 8,026.2 |
| 2014 | 9,555.4 | 8,708.2 | 7,225.9 | 3,708.1 | 1,833.4 | 1,363.7 | 1,168.2 | 1,293.5 | 2,344.8 | 2,714.8 | 4,385.2 | 6,554.1 |
| 2015 | 8,923.3 | 10,698.9 | 6,946.6 | 3,931.8 | 1,527.8 | 1,251.0 | 1,031.5 | 1,294.1 | 1,888.1 | 3,115.9 | 3,682.7 | 5,361.2 |
| 2016 | 7,661.4 | 7,545.7 | 5,236.4 | 3,645.2 | 2,113.6 | 1,128.5 | 796.8 | 1,042.7 | 1,629.3 | 2,641.2 | 4,265.8 | 7,342.3 |
| 2017 | 7,004.1 | 6,895.0 | 6,681.2 | 3,145.8 | 2,064.0 | 1,461.4 | 969.0 | 1,290.8 | 1,604.0 | 2,049.2 | 4,697.5 | 7,825.6 |
| 2018 | 10,118.1 | 7,142.5 | 5,924.2 | 4,156.3 | 1,708.2 | 1,175.9 | 817.8 | 1,032.3 | 1,700.1 | 3,125.2 | 5,126.8 | 6,656.5 |
| 2019 | 7,945.7 | 7,320.1 | 5,724.2 | 3,116.6 | 1,969.1 | 1,122.9 | 873.5 | 1,039.6 | 1,844.3 | 2,601.9 | 4,628.7 | 6,616.9 |
| 2020 | 6,683.1 | 6,180.0 | 5,005.9 | 4,153.4 | 2,431.0 | 1,130.2 | 740.1 | 798.8 | 1,692.0 | 2,306.3 | 3,609.8 | 6,088.7 |
| 2021 | 6,721.0 | 7,335.3 | 5,319.6 | 2,801.4 | 1,632.6 | 1,039.2 | 794.0 | 924.4 | 1,373.4 | 2,217.7 | 3,582.3 | 5,796.1 |
| 2022 | 7,521.7 | 7,502.3 | 4,997.0 | |||||||||
| - = No Data Reported; -- = Not Applicable; NA = Not Available; W = Withheld to avoid disclosure of individual company data. |
| Release Date: 5/19/2022 |
| Next Release Date: TBD |