|
Download Data (XLS File) |
|
||||||||
|
||||||||
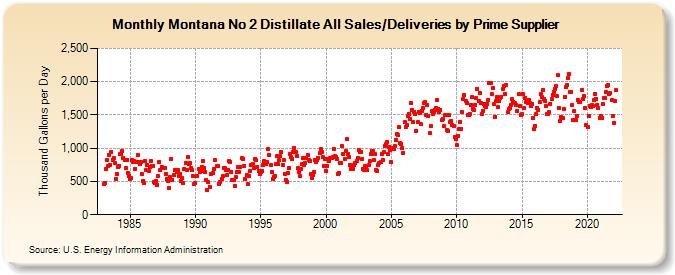
| Montana No 2 Distillate All Sales/Deliveries by Prime Supplier (Thousand Gallons per Day) | ||||||||
| Year | Jan | Feb | Mar | Apr | May | Jun | Jul | Aug | Sep | Oct | Nov | Dec |
|---|---|---|---|---|---|---|---|---|---|---|---|---|
| 1983 | 455.7 | 482.5 | 693.8 | 829.3 | 734.3 | 897.3 | 754.2 | 946.9 | 826.7 | 846.3 | 770.6 | 537.0 |
| 1984 | 616.3 | 714.3 | 733.0 | 906.1 | 906.3 | 962.5 | 854.3 | 816.7 | 699.1 | 828.5 | 627.8 | 576.9 |
| 1985 | 540.3 | 546.3 | 826.0 | 788.8 | 804.4 | 690.4 | 798.2 | 894.8 | 788.5 | 763.0 | 799.8 | 611.3 |
| 1986 | 511.7 | 474.5 | 810.2 | 666.6 | 750.8 | 654.0 | 721.6 | 802.7 | 739.5 | 737.0 | 497.5 | 483.0 |
| 1987 | 503.5 | 451.9 | 584.1 | 793.4 | 665.2 | 724.5 | W | 699.2 | 708.8 | 614.7 | 530.0 | 504.7 |
| 1988 | 399.4 | 565.0 | 843.0 | 523.9 | 598.0 | 675.8 | 670.5 | 641.9 | 669.5 | 589.2 | 612.5 | 507.7 |
| 1989 | 546.3 | 475.1 | 684.4 | 776.9 | 672.1 | 870.4 | 756.5 | 775.2 | 695.2 | 669.9 | 578.7 | 467.4 |
| 1990 | 479.7 | 580.1 | W | 684.1 | 645.0 | 653.2 | 718.5 | 800.0 | 708.0 | 647.1 | 526.3 | 369.1 |
| 1991 | 486.2 | 421.1 | 610.1 | W | 621.2 | 683.7 | 821.2 | W | 733.1 | 725.5 | 461.1 | 498.4 |
| 1992 | 531.5 | 577.9 | 707.1 | 698.1 | 666.0 | 592.6 | 672.6 | 802.5 | 792.9 | 647.7 | 515.1 | 521.2 |
| 1993 | 437.9 | 564.8 | 638.8 | 723.3 | 644.4 | 717.0 | W | 849.1 | 839.7 | 738.2 | 540.4 | 603.8 |
| 1994 | 454.6 | 583.3 | 658.2 | 741.1 | 742.0 | 759.7 | 696.9 | 842.3 | 815.8 | 721.9 | 656.3 | 605.8 |
| 1995 | 634.8 | 662.4 | 745.3 | 810.1 | 779.6 | 768.6 | 795.8 | 987.8 | 892.3 | 741.0 | 639.0 | 529.6 |
| 1996 | 563.9 | 583.2 | 761.4 | 884.8 | 758.5 | 821.8 | 885.9 | 939.1 | 749.9 | 818.0 | 613.5 | 528.0 |
| 1997 | 493.7 | 622.3 | 697.8 | 910.3 | 865.8 | 833.9 | 936.5 | 1,007.9 | 948.2 | 890.0 | 696.0 | 641.0 |
| 1998 | 575.7 | 683.8 | 764.8 | 856.6 | 754.7 | 771.6 | 859.6 | 893.4 | 817.8 | 801.2 | 609.2 | 554.5 |
| 1999 | 590.8 | 636.8 | 829.6 | 794.7 | 817.4 | 855.8 | 922.6 | 980.3 | 938.2 | 865.7 | 731.8 | 832.7 |
| 2000 | 663.2 | 730.8 | 840.3 | 805.7 | 857.5 | 858.2 | 869.4 | 991.5 | 877.9 | 864.9 | 830.3 | 614.6 |
| 2001 | 630.3 | 772.6 | 779.9 | 1,027.9 | 912.5 | 839.2 | 963.9 | 1,135.4 | 918.9 | 872.1 | 753.9 | 689.5 |
| 2002 | 720.6 | 686.7 | 745.0 | 777.8 | 811.5 | 845.7 | 973.7 | 946.0 | 946.7 | 844.4 | 688.0 | 671.5 |
| 2003 | 734.6 | 701.6 | 665.9 | 744.6 | 805.4 | 909.1 | 961.9 | 950.5 | 825.3 | 907.9 | 677.4 | 663.5 |
| 2004 | 740.0 | 770.2 | 785.7 | 910.1 | 826.3 | 935.2 | 1,037.4 | 1,063.8 | 1,100.4 | 914.7 | 1,021.9 | 967.3 |
| 2005 | 786.5 | 995.9 | 989.4 | 1,030.1 | 1,125.5 | 1,215.3 | 1,194.3 | 1,312.4 | 1,081.7 | 1,069.9 | 1,005.6 | 932.1 |
| 2006 | 1,389.1 | 1,318.3 | 1,341.2 | 1,485.7 | 1,520.7 | 1,440.0 | 1,678.1 | 1,571.5 | 1,393.9 | 1,551.4 | 1,512.9 | 1,265.6 |
| 2007 | 1,393.5 | 1,549.0 | 1,531.8 | 1,357.0 | 1,566.2 | 1,604.5 | 1,676.3 | 1,688.7 | 1,500.3 | 1,653.2 | 1,482.2 | 1,221.7 |
| 2008 | 1,333.5 | 1,553.9 | 1,520.7 | 1,547.3 | 1,575.1 | 1,601.7 | 1,724.9 | 1,596.4 | 1,548.3 | 1,575.2 | 1,419.8 | 1,434.0 |
| 2009 | 1,333.5 | 1,498.0 | 1,499.1 | 1,275.0 | 1,253.5 | 1,500.0 | 1,398.6 | 1,406.0 | 1,341.6 | 1,340.2 | 1,167.1 | 1,136.2 |
| 2010 | 1,044.4 | 1,180.6 | 1,287.6 | 1,397.6 | 1,287.6 | 1,536.4 | 1,736.0 | 1,806.0 | 1,707.9 | 1,680.3 | 1,501.2 | 1,491.6 |
| 2011 | 1,519.3 | 1,654.8 | 1,768.9 | 1,592.9 | 1,567.7 | 1,653.0 | 1,748.4 | 1,894.0 | 1,704.9 | 1,827.3 | 1,677.5 | 1,514.7 |
| 2012 | 1,564.3 | 1,667.7 | 1,637.3 | 1,624.2 | 1,671.3 | 1,730.0 | 1,982.9 | 1,986.9 | 1,810.9 | 1,897.2 | 1,658.9 | 1,470.8 |
| 2013 | 1,712.0 | 1,771.4 | 1,618.9 | 1,704.7 | 1,751.2 | 1,775.9 | 1,885.1 | 1,931.7 | 1,809.1 | 1,949.9 | W | 1,537.2 |
| 2014 | 1,592.3 | 1,604.2 | 1,647.8 | 1,735.2 | 1,699.0 | 1,683.3 | 1,645.0 | 1,556.5 | W | 1,810.5 | 1,639.7 | 1,495.0 |
| 2015 | 1,507.9 | 1,810.2 | 1,601.9 | 1,758.4 | 1,699.3 | 1,673.3 | 1,722.3 | 1,681.3 | 1,632.3 | 1,668.0 | 1,450.4 | 1,284.1 |
| 2016 | 1,335.9 | 1,512.2 | 1,608.5 | 1,578.1 | 1,691.2 | 1,808.3 | 1,762.8 | 1,879.0 | 1,732.3 | 1,708.1 | 1,640.2 | 1,511.0 |
| 2017 | 1,508.0 | 1,544.9 | 1,670.9 | 1,735.1 | 1,803.2 | 1,841.0 | 1,889.5 | 1,934.2 | 1,777.7 | 2,094.0 | 1,600.6 | 1,403.5 |
| 2018 | 1,467.0 | 1,447.3 | 1,586.5 | 1,769.4 | 1,915.2 | 1,946.4 | 2,054.0 | 2,117.0 | 1,846.7 | 1,844.7 | 1,647.2 | 1,420.3 |
| 2019 | 1,553.6 | 1,420.1 | 1,479.2 | 1,725.6 | 1,694.4 | 1,694.7 | W | 1,876.2 | 1,733.2 | 1,777.2 | 1,611.0 | 1,348.7 |
| 2020 | 1,316.1 | 1,490.0 | 1,639.1 | 1,616.1 | 1,644.3 | 1,633.3 | 1,720.0 | 1,816.9 | 1,742.6 | 1,655.4 | 1,596.9 | 1,454.9 |
| 2021 | 1,487.5 | 1,450.4 | 1,660.0 | 1,754.6 | 1,748.0 | 1,845.5 | 1,940.5 | 1,948.4 | 1,817.9 | 1,822.9 | 1,720.2 | 1,489.7 |
| 2022 | 1,384.9 | 1,709.7 | 1,870.4 | |||||||||
| - = No Data Reported; -- = Not Applicable; NA = Not Available; W = Withheld to avoid disclosure of individual company data. |
| Release Date: 5/19/2022 |
| Next Release Date: TBD |