|
Download Data (XLS File) |
|
||||||||
|
||||||||
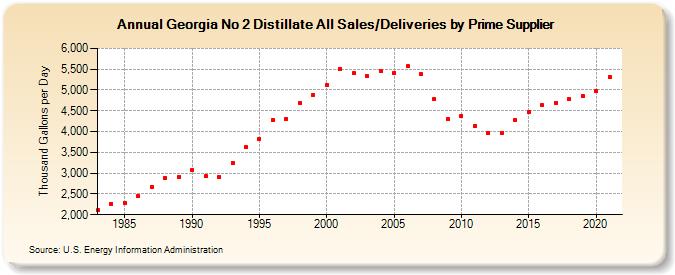
| Georgia No 2 Distillate All Sales/Deliveries by Prime Supplier (Thousand Gallons per Day) | ||||||||
| Decade | Year-0 | Year-1 | Year-2 | Year-3 | Year-4 | Year-5 | Year-6 | Year-7 | Year-8 | Year-9 |
|---|---|---|---|---|---|---|---|---|---|---|
| 1980's | 2,103.6 | 2,267.3 | 2,288.6 | 2,438.7 | 2,678.1 | 2,879.2 | 2,901.6 | |||
| 1990's | 3,082.9 | 2,922.9 | 2,906.2 | 3,253.0 | 3,625.8 | 3,825.2 | 4,281.4 | 4,306.6 | 4,691.5 | 4,887.9 |
| 2000's | 5,110.9 | 5,509.8 | 5,402.6 | 5,327.3 | 5,463.3 | 5,414.4 | 5,565.7 | 5,375.4 | 4,780.8 | 4,292.8 |
| 2010's | 4,379.2 | 4,132.3 | 3,964.6 | 3,975.4 | 4,280.1 | 4,468.7 | 4,629.8 | 4,696.9 | 4,781.5 | 4,856.7 |
| 2020's | 4,986.4 |
| - = No Data Reported; -- = Not Applicable; NA = Not Available; W = Withheld to avoid disclosure of individual company data. |
| Release Date: 6/1/2022 |
| Next Release Date: TBD |