|
Download Data (XLS File) |
|
||||||||
|
||||||||
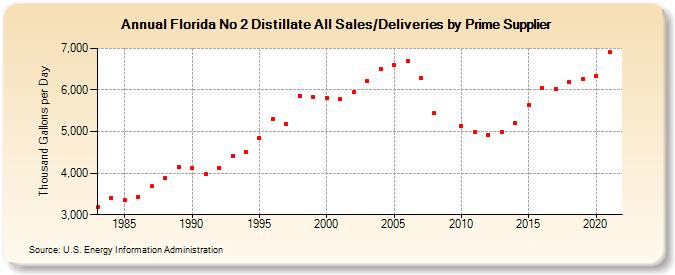
| Florida No 2 Distillate All Sales/Deliveries by Prime Supplier (Thousand Gallons per Day) | ||||||||
| Decade | Year-0 | Year-1 | Year-2 | Year-3 | Year-4 | Year-5 | Year-6 | Year-7 | Year-8 | Year-9 |
|---|---|---|---|---|---|---|---|---|---|---|
| 1980's | 3,183.5 | 3,411.9 | 3,347.0 | 3,436.0 | 3,684.6 | 3,874.2 | 4,147.0 | |||
| 1990's | 4,112.5 | 3,968.8 | 4,128.3 | 4,414.7 | 4,503.3 | 4,853.4 | 5,300.0 | 5,191.5 | 5,866.8 | 5,823.1 |
| 2000's | 5,810.1 | 5,776.9 | 5,940.4 | 6,215.6 | 6,495.2 | 6,599.2 | 6,690.8 | 6,279.8 | 5,436.8 | W |
| 2010's | 5,142.5 | 4,986.7 | 4,924.4 | 4,982.8 | 5,214.5 | 5,629.1 | 6,041.9 | 6,022.0 | 6,180.7 | 6,260.0 |
| 2020's | 6,329.8 |
| - = No Data Reported; -- = Not Applicable; NA = Not Available; W = Withheld to avoid disclosure of individual company data. |
| Release Date: 6/1/2022 |
| Next Release Date: TBD |