|
Download Data (XLS File) |
|
||||||||
|
||||||||
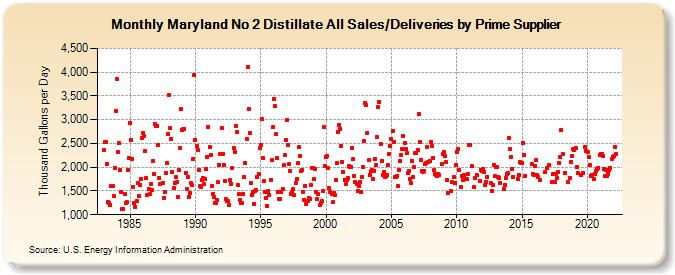
| Maryland No 2 Distillate All Sales/Deliveries by Prime Supplier (Thousand Gallons per Day) | ||||||||
| Year | Jan | Feb | Mar | Apr | May | Jun | Jul | Aug | Sep | Oct | Nov | Dec |
|---|---|---|---|---|---|---|---|---|---|---|---|---|
| 1983 | 2,362.4 | 2,522.0 | 2,520.8 | 2,069.8 | 1,277.5 | 1,239.4 | 1,210.3 | 1,597.1 | 1,597.4 | 1,393.1 | 1,982.5 | 3,172.7 |
| 1984 | 3,865.5 | 2,322.9 | 2,500.2 | 1,936.3 | 1,480.6 | 1,110.9 | 1,119.9 | 1,437.1 | 1,255.5 | 1,259.9 | 1,947.2 | 2,201.7 |
| 1985 | 2,937.7 | 2,566.5 | 2,171.4 | 1,578.5 | 1,244.1 | 1,171.2 | 1,283.4 | 1,660.1 | 1,400.5 | 1,616.8 | 1,757.9 | 2,619.2 |
| 1986 | 2,726.4 | 2,654.8 | 2,337.6 | 1,764.1 | 1,418.2 | 1,551.5 | 1,428.8 | 1,644.2 | 1,514.6 | 2,139.8 | 1,859.6 | 2,915.9 |
| 1987 | 2,875.0 | 2,877.3 | 2,460.7 | 1,780.7 | 1,650.2 | W | 1,673.4 | 1,342.4 | 1,482.3 | 1,885.7 | 2,083.2 | 2,696.8 |
| 1988 | 3,520.1 | 2,820.6 | 2,595.5 | 1,896.5 | 1,554.3 | 1,675.5 | 1,784.3 | 1,694.5 | 1,376.3 | 1,931.4 | 2,397.4 | 3,226.3 |
| 1989 | 2,774.0 | 2,797.6 | 2,811.8 | 1,884.2 | 1,545.0 | 1,783.9 | 1,363.0 | 1,458.5 | 1,664.3 | 1,620.4 | 2,177.7 | 3,950.3 |
| 1990 | 2,577.9 | 2,441.8 | 2,364.0 | 1,940.7 | 1,598.2 | 1,575.9 | 1,723.9 | 1,775.9 | 1,639.4 | 1,749.9 | 1,963.0 | 2,218.9 |
| 1991 | 2,842.2 | 2,424.2 | 2,255.4 | 1,606.3 | 1,435.7 | 1,363.6 | 1,237.4 | 1,243.2 | 1,311.2 | 1,694.5 | 2,047.3 | 2,287.5 |
| 1992 | 2,830.2 | 2,283.8 | 2,048.8 | 1,706.1 | 1,329.1 | 1,282.3 | 1,290.7 | 1,199.1 | 1,727.0 | 1,655.8 | 1,974.6 | 2,405.5 |
| 1993 | 2,328.5 | 2,864.0 | 2,739.2 | 1,616.3 | 1,439.8 | 1,302.5 | 1,246.7 | 1,256.1 | 1,443.3 | 1,787.1 | 2,091.1 | 2,602.3 |
| 1994 | 4,118.9 | 3,233.4 | 2,715.7 | 1,672.7 | 1,424.8 | 1,477.2 | 1,226.2 | 1,499.0 | 1,528.6 | 1,793.4 | 1,863.8 | 2,393.4 |
| 1995 | 2,470.6 | 3,006.4 | 2,190.6 | 1,699.6 | 1,468.3 | 1,358.3 | 1,183.9 | 1,488.9 | 1,411.4 | 1,723.6 | 2,149.1 | 2,838.7 |
| 1996 | 3,439.2 | 3,278.5 | 2,700.6 | 2,194.0 | 1,476.3 | 1,324.5 | 1,322.3 | 1,472.0 | 1,545.4 | 2,037.9 | 2,252.6 | 2,576.2 |
| 1997 | 3,002.2 | 2,461.7 | 2,063.0 | 1,929.2 | 1,443.2 | 1,471.7 | 1,532.9 | 1,405.5 | 1,657.2 | 1,741.3 | 2,078.8 | 2,422.9 |
| 1998 | 2,243.7 | 1,928.8 | 1,943.8 | 1,481.4 | 1,312.7 | 1,612.9 | 1,227.2 | 1,288.6 | 1,345.3 | 1,333.5 | 1,620.4 | 1,993.4 |
| 1999 | 1,989.6 | 1,748.1 | 1,967.9 | 1,472.1 | 1,333.3 | 1,429.4 | 1,204.6 | 1,240.2 | 1,278.2 | 1,496.7 | 2,838.3 | 2,034.3 |
| 2000 | 2,207.6 | 2,234.0 | 1,974.9 | 1,572.3 | 1,475.7 | 1,441.6 | 1,268.0 | 1,465.2 | 1,408.7 | 1,729.8 | 2,079.2 | 2,746.6 |
| 2001 | 2,893.9 | 2,793.3 | 2,456.1 | 2,111.5 | 1,896.1 | 1,734.0 | 1,638.5 | 1,739.5 | 1,770.2 | 2,027.7 | 2,011.4 | 2,012.1 |
| 2002 | 2,410.9 | 2,163.7 | 1,811.1 | 1,694.3 | 1,648.0 | 1,495.7 | 1,611.8 | 1,683.8 | 1,477.0 | 1,799.1 | 2,004.3 | 2,551.0 |
| 2003 | 3,348.4 | 3,311.0 | 2,719.7 | 2,142.1 | 1,846.2 | 1,914.5 | 1,932.6 | 1,754.0 | 1,927.8 | 2,181.0 | 2,052.8 | 2,637.4 |
| 2004 | 3,271.1 | 3,381.9 | 2,487.8 | 2,138.7 | 1,835.4 | 1,906.7 | 1,791.4 | 1,821.6 | 1,834.9 | 2,043.1 | 2,269.4 | 2,447.5 |
| 2005 | 2,603.1 | 2,755.1 | 2,519.8 | 1,799.8 | 1,793.6 | 1,822.7 | 1,595.2 | 1,944.9 | 2,121.4 | 2,262.0 | 2,377.4 | 2,665.7 |
| 2006 | 2,506.0 | 2,379.1 | 2,288.8 | 1,884.3 | 1,911.5 | 1,747.3 | 1,663.1 | 2,130.8 | 1,785.9 | 1,997.6 | 2,290.2 | 2,293.2 |
| 2007 | 2,355.8 | 3,115.3 | 2,525.8 | 2,152.0 | 1,915.4 | 1,898.0 | 1,922.1 | 2,060.4 | 2,086.7 | 2,414.5 | 2,105.7 | 2,133.6 |
| 2008 | 2,536.4 | 2,442.7 | 2,201.4 | 1,933.3 | 1,850.8 | 1,831.0 | 1,817.9 | 1,858.4 | 1,836.1 | W | 2,072.7 | 2,277.1 |
| 2009 | 2,313.6 | 2,229.0 | 2,099.9 | 1,737.6 | 1,463.1 | W | W | 1,493.7 | 1,685.0 | 1,794.4 | 1,663.4 | 2,049.8 |
| 2010 | 2,309.6 | 2,374.1 | 1,932.5 | W | 1,580.9 | 1,804.9 | 1,735.4 | 1,831.5 | 1,748.2 | 1,751.3 | 1,863.0 | 2,467.4 |
| 2011 | 2,471.9 | NA | 2,023.5 | W | 1,588.3 | 1,773.9 | W | 1,826.2 | W | 1,706.4 | 1,946.5 | 1,921.8 |
| 2012 | 1,966.4 | 1,891.0 | 1,622.8 | 1,696.0 | 1,801.9 | W | W | 1,661.8 | 1,508.1 | 1,621.7 | 2,050.7 | 1,804.4 |
| 2013 | 2,006.2 | 2,007.7 | 1,795.1 | 1,780.0 | 1,676.7 | W | W | 1,547.4 | 1,630.5 | 1,763.2 | 1,862.4 | 1,869.2 |
| 2014 | 2,616.4 | 2,387.2 | 2,205.5 | 1,964.1 | 1,800.3 | W | W | W | 1,749.3 | 1,832.0 | 2,109.9 | 2,089.0 |
| 2015 | 2,094.9 | 2,512.9 | 2,256.4 | 1,821.8 | W | W | W | W | W | 2,062.0 | 1,862.1 | 1,839.5 |
| 2016 | 2,033.0 | 2,151.0 | 1,841.3 | 1,795.3 | 1,734.2 | W | W | W | W | 1,893.4 | W | 1,983.8 |
| 2017 | W | 2,047.0 | W | 1,684.6 | 1,849.3 | W | 1,698.4 | 1,867.2 | 1,769.6 | 1,895.2 | 2,096.3 | 2,210.9 |
| 2018 | 2,779.7 | 2,275.1 | W | 1,883.8 | W | W | 1,684.6 | W | 1,777.9 | 2,114.5 | 2,231.4 | 2,375.6 |
| 2019 | 2,366.1 | 2,413.3 | 2,003.8 | 1,871.6 | W | W | 1,833.4 | W | 1,883.3 | W | 2,422.7 | 2,348.8 |
| 2020 | 2,313.6 | 2,209.0 | 2,038.9 | 1,823.6 | 1,833.0 | W | 1,758.5 | 1,848.3 | 1,917.7 | 1,952.8 | 1,989.8 | 2,265.7 |
| 2021 | 2,284.4 | 2,285.8 | 2,228.8 | 1,959.2 | 1,824.2 | 1,942.2 | 1,817.3 | 1,863.7 | 1,950.9 | 1,986.1 | 2,173.4 | 2,220.8 |
| 2022 | 2,236.5 | 2,434.9 | 2,281.8 | |||||||||
| - = No Data Reported; -- = Not Applicable; NA = Not Available; W = Withheld to avoid disclosure of individual company data. |
| Release Date: 5/19/2022 |
| Next Release Date: TBD |