|
Download Data (XLS File) |
|
||||||||
|
||||||||
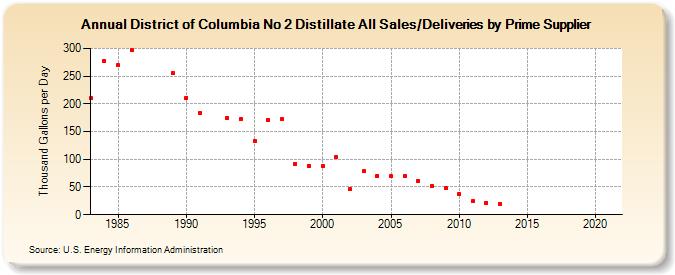
| District of Columbia No 2 Distillate All Sales/Deliveries by Prime Supplier (Thousand Gallons per Day) | ||||||||
| Decade | Year-0 | Year-1 | Year-2 | Year-3 | Year-4 | Year-5 | Year-6 | Year-7 | Year-8 | Year-9 |
|---|---|---|---|---|---|---|---|---|---|---|
| 1980's | 210.4 | 277.5 | 269.2 | 296.3 | W | W | 255.4 | |||
| 1990's | 211.2 | 184.0 | W | 174.1 | 172.2 | 132.7 | 171.6 | 172.4 | 92.3 | 88.4 |
| 2000's | 87.9 | 104.3 | 46.5 | 78.0 | 70.2 | 69.2 | 69.4 | 61.1 | 50.9 | 47.7 |
| 2010's | 37.6 | 24.4 | 22.0 | 20.0 | W | W | W | W | W | W |
| 2020's | W |
| - = No Data Reported; -- = Not Applicable; NA = Not Available; W = Withheld to avoid disclosure of individual company data. |
| Release Date: 6/1/2022 |
| Next Release Date: TBD |