|
Download Data (XLS File) |
|
||||||||
|
||||||||
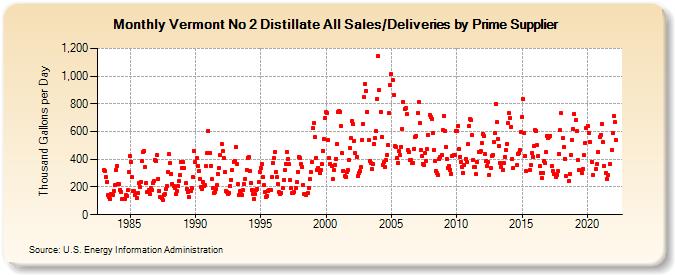
| Vermont No 2 Distillate All Sales/Deliveries by Prime Supplier (Thousand Gallons per Day) | ||||||||
| Year | Jan | Feb | Mar | Apr | May | Jun | Jul | Aug | Sep | Oct | Nov | Dec |
|---|---|---|---|---|---|---|---|---|---|---|---|---|
| 1983 | 320.0 | 312.9 | 272.1 | 235.5 | 142.8 | 126.2 | 110.9 | 146.8 | 142.3 | 172.0 | 212.6 | 320.2 |
| 1984 | 352.2 | 224.1 | 221.5 | 180.5 | 163.9 | 112.8 | 115.9 | 115.7 | 138.9 | 138.1 | 175.5 | 307.6 |
| 1985 | 423.3 | 380.8 | 268.8 | 172.1 | 168.0 | 139.7 | 123.1 | 157.2 | 226.2 | 203.1 | 238.2 | 387.2 |
| 1986 | 450.1 | 458.4 | 344.1 | 226.8 | 162.7 | 177.1 | 149.3 | 191.7 | 180.0 | 231.9 | 241.0 | 395.4 |
| 1987 | 385.1 | 433.6 | 260.1 | 171.7 | 124.8 | 117.6 | 108.0 | 145.5 | 148.8 | 185.9 | 206.6 | 305.8 |
| 1988 | 435.3 | 372.9 | 293.9 | 223.9 | 204.3 | 191.7 | 147.1 | 172.8 | 204.5 | 245.0 | 285.0 | 379.1 |
| 1989 | 338.8 | 377.1 | 335.6 | 225.3 | 188.3 | 163.6 | 129.3 | 168.6 | 173.1 | 190.4 | 269.1 | 461.0 |
| 1990 | 379.8 | 412.6 | 353.5 | 314.1 | 260.5 | 200.8 | 188.4 | 232.7 | 206.2 | 211.9 | 348.1 | 443.3 |
| 1991 | 606.2 | 446.0 | 353.5 | 255.4 | 190.5 | 157.6 | 163.7 | 185.3 | 213.2 | 291.8 | 340.0 | 430.4 |
| 1992 | 511.8 | 459.2 | 409.3 | 309.8 | 169.0 | 163.9 | 150.6 | 158.7 | 207.2 | 253.7 | 324.2 | 382.6 |
| 1993 | 386.5 | 488.7 | 367.3 | 220.7 | 140.7 | 167.5 | 148.0 | 143.0 | 175.8 | 219.3 | 260.5 | 326.1 |
| 1994 | 412.6 | 416.8 | 314.1 | 231.9 | 179.7 | 150.3 | 115.4 | 146.7 | 178.7 | 184.9 | 232.6 | 309.4 |
| 1995 | 338.6 | 365.2 | 273.0 | 213.3 | 165.8 | 129.8 | 135.3 | 170.8 | 177.8 | 181.5 | 269.5 | 374.1 |
| 1996 | 412.0 | 454.4 | 309.2 | 268.6 | 220.7 | 161.0 | 147.6 | 160.1 | 190.1 | 250.6 | 319.3 | 368.6 |
| 1997 | 452.6 | 404.1 | 363.5 | 248.9 | 190.9 | 156.1 | 159.1 | 167.0 | 193.6 | 235.6 | 310.6 | 417.1 |
| 1998 | 411.5 | 364.8 | 343.6 | 214.6 | 151.0 | 152.3 | 144.9 | 155.6 | 194.6 | 254.5 | 305.9 | 378.0 |
| 1999 | 626.1 | 665.0 | 557.5 | 411.4 | 323.0 | 340.1 | 298.7 | 324.1 | 365.0 | 460.8 | 544.1 | 697.8 |
| 2000 | 738.6 | 734.1 | 540.2 | 409.7 | 368.5 | 349.3 | 256.0 | 320.4 | 362.0 | 404.1 | 510.4 | 743.3 |
| 2001 | 750.7 | 742.9 | 638.2 | 442.5 | 317.2 | 276.0 | 274.5 | 308.6 | 322.6 | 396.0 | 479.7 | 550.9 |
| 2002 | 674.5 | 651.3 | 532.7 | 444.0 | 419.0 | 276.6 | 298.0 | 314.1 | 343.7 | 542.1 | 657.0 | 847.1 |
| 2003 | 946.0 | 893.2 | 744.1 | 536.5 | 386.7 | 372.5 | 330.4 | 365.5 | 508.5 | 551.0 | 602.6 | 837.1 |
| 2004 | 1,145.0 | 902.1 | 742.6 | 562.0 | 361.2 | 377.5 | 344.5 | 393.3 | 433.8 | 500.0 | 731.8 | 935.0 |
| 2005 | 1,013.3 | 973.4 | 863.9 | 495.1 | 488.9 | 408.3 | 376.6 | 459.9 | 430.9 | 491.1 | 621.5 | 813.7 |
| 2006 | 760.9 | 767.7 | 723.5 | 466.2 | 449.5 | 394.6 | 396.0 | 375.8 | 376.0 | 476.6 | 557.2 | 570.4 |
| 2007 | 734.5 | 810.7 | 662.9 | 466.2 | 422.6 | 368.2 | 356.9 | 442.5 | 389.1 | 472.4 | 575.9 | 720.8 |
| 2008 | 704.5 | 689.2 | 587.7 | 467.4 | 389.0 | 315.9 | 297.9 | 283.5 | 401.0 | 418.7 | 430.0 | 610.3 |
| 2009 | 715.8 | 605.9 | 490.8 | 401.1 | 339.0 | 351.6 | 325.2 | 295.9 | 425.3 | 432.5 | 431.2 | 606.4 |
| 2010 | 600.6 | 642.4 | 476.0 | 418.8 | 380.4 | 342.6 | 299.8 | 355.6 | 404.2 | 382.4 | 508.3 | 641.0 |
| 2011 | 690.3 | 682.9 | 573.7 | 396.7 | 343.1 | 342.3 | 292.1 | 379.7 | 451.9 | 449.9 | 457.4 | 515.7 |
| 2012 | 584.0 | 566.9 | 436.9 | 388.9 | 354.8 | 379.8 | 287.3 | 338.6 | 423.7 | 433.0 | 525.2 | 587.4 |
| 2013 | 801.7 | 666.7 | 549.1 | 496.3 | 376.0 | 343.2 | 326.1 | 373.6 | 416.8 | 465.3 | 512.5 | 659.5 |
| 2014 | 730.4 | 695.8 | 636.1 | 403.9 | 339.2 | W | W | 358.2 | 440.6 | 442.7 | 465.9 | 596.9 |
| 2015 | 706.2 | 832.3 | 592.0 | 422.7 | 313.1 | W | W | 321.5 | 357.7 | 446.7 | 419.3 | 492.5 |
| 2016 | 609.9 | 607.5 | 499.5 | 425.3 | 349.1 | 303.2 | 262.1 | 302.6 | 384.7 | 374.7 | 451.7 | 570.2 |
| 2017 | 556.8 | 563.0 | 570.8 | 350.2 | 316.1 | 296.2 | W | 270.0 | 288.3 | 313.0 | 441.2 | 607.7 |
| 2018 | 731.6 | 550.5 | 489.6 | 403.8 | 278.2 | W | W | 240.1 | 295.6 | 433.7 | 539.6 | 617.7 |
| 2019 | 728.2 | 681.8 | 600.7 | 393.7 | 324.5 | W | W | 301.0 | 330.8 | 431.5 | 521.0 | 627.9 |
| 2020 | 642.5 | 592.5 | 527.5 | W | 383.5 | 287.7 | W | W | 331.1 | 366.4 | 453.1 | 561.3 |
| 2021 | 574.4 | 657.3 | 524.6 | 350.6 | W | 303.5 | 259.2 | 283.4 | W | 365.4 | 465.5 | 588.8 |
| 2022 | 710.8 | 666.1 | 538.8 | |||||||||
| - = No Data Reported; -- = Not Applicable; NA = Not Available; W = Withheld to avoid disclosure of individual company data. |
| Release Date: 5/19/2022 |
| Next Release Date: TBD |