|
Download Data (XLS File) |
|
||||||||
|
||||||||
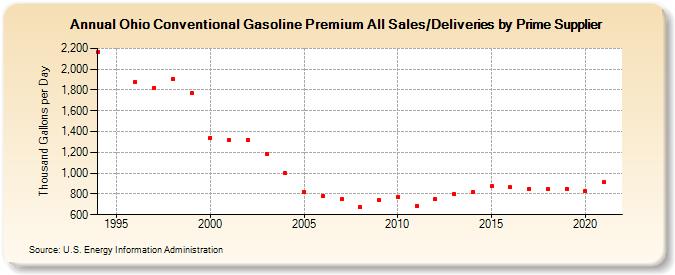
| Ohio Conventional Gasoline Premium All Sales/Deliveries by Prime Supplier (Thousand Gallons per Day) | ||||||||
| Decade | Year-0 | Year-1 | Year-2 | Year-3 | Year-4 | Year-5 | Year-6 | Year-7 | Year-8 | Year-9 |
|---|---|---|---|---|---|---|---|---|---|---|
| 1990's | 2,166.9 | W | 1,877.1 | 1,822.6 | 1,904.9 | 1,775.0 | ||||
| 2000's | 1,341.7 | 1,319.6 | 1,320.7 | 1,186.5 | 1,000.6 | 820.4 | 779.5 | 748.9 | 669.7 | 737.2 |
| 2010's | 771.9 | 685.9 | 750.9 | 797.2 | 817.8 | 871.7 | 862.0 | 850.8 | 843.7 | 847.6 |
| 2020's | 824.0 |
| - = No Data Reported; -- = Not Applicable; NA = Not Available; W = Withheld to avoid disclosure of individual company data. |
| Release Date: 6/1/2022 |
| Next Release Date: TBD |