|
Download Data (XLS File) |
|
||||||||
|
||||||||
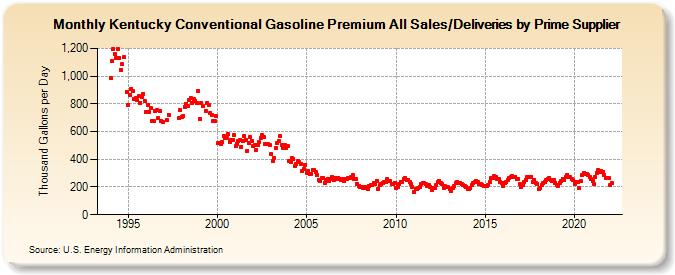
| Kentucky Conventional Gasoline Premium All Sales/Deliveries by Prime Supplier (Thousand Gallons per Day) | ||||||||
| Year | Jan | Feb | Mar | Apr | May | Jun | Jul | Aug | Sep | Oct | Nov | Dec |
|---|---|---|---|---|---|---|---|---|---|---|---|---|
| 1993 | NA | NA | NA | |||||||||
| 1994 | 986.6 | 1,105.8 | 1,197.2 | 1,157.9 | 1,131.5 | 1,196.7 | 1,131.8 | 1,047.0 | 1,084.5 | 1,135.3 | W | 883.5 |
| 1995 | 790.9 | 867.3 | 909.2 | 890.2 | 832.2 | 843.3 | 826.7 | 856.1 | 807.3 | 845.8 | 872.2 | 820.2 |
| 1996 | 738.3 | 790.9 | 740.8 | 767.4 | 673.6 | 674.1 | 748.1 | 752.0 | 694.2 | 750.6 | 678.3 | 667.0 |
| 1997 | W | W | 686.4 | 720.1 | W | W | W | W | W | W | 697.8 | 755.2 |
| 1998 | 706.3 | 712.9 | 776.0 | 802.0 | 783.6 | 830.3 | 839.6 | 808.4 | 833.0 | 820.0 | 802.9 | 894.7 |
| 1999 | 693.5 | 806.2 | 786.2 | W | 750.2 | 807.7 | 795.0 | 733.1 | 717.8 | 673.0 | 674.6 | 712.6 |
| 2000 | 514.0 | 516.9 | 511.8 | 523.4 | 566.2 | 551.0 | 554.0 | 579.4 | 524.6 | 538.7 | 542.4 | 573.6 |
| 2001 | 493.9 | 512.8 | 529.1 | 537.3 | 491.7 | 529.2 | 567.6 | 541.3 | 463.2 | 519.5 | 559.0 | 534.3 |
| 2002 | 498.5 | 501.9 | 469.1 | 504.0 | 524.7 | 553.0 | 577.7 | 559.0 | 507.9 | 508.5 | 510.6 | 501.9 |
| 2003 | 439.2 | 385.9 | 410.3 | 482.7 | 516.6 | 528.9 | 567.9 | 503.3 | 479.8 | 501.8 | 478.8 | 493.6 |
| 2004 | 390.8 | 377.6 | 406.7 | 398.7 | 349.5 | 366.0 | 387.9 | 378.3 | 367.2 | 317.0 | 329.5 | 361.4 |
| 2005 | 299.3 | 314.4 | 296.5 | 294.7 | 323.4 | 320.9 | 310.7 | 285.1 | 247.8 | 244.5 | 266.5 | 265.1 |
| 2006 | 230.0 | 248.3 | 258.4 | 241.6 | 254.7 | 274.0 | 253.5 | 267.3 | 260.3 | 266.0 | 260.5 | 252.8 |
| 2007 | 255.3 | 242.6 | 257.6 | 257.7 | 261.8 | 261.6 | 275.0 | 284.8 | 255.4 | 260.1 | 221.5 | 209.0 |
| 2008 | 199.2 | 200.8 | 195.5 | 199.8 | 191.3 | 187.4 | 208.3 | 211.6 | 211.4 | 226.9 | 221.0 | 245.3 |
| 2009 | 187.3 | 211.5 | 220.5 | 229.4 | 233.9 | 239.2 | 257.2 | 243.4 | 242.5 | 224.5 | 224.9 | 230.5 |
| 2010 | 194.5 | 202.3 | 220.4 | 239.5 | 238.8 | 255.2 | 265.5 | 253.0 | 252.5 | 232.6 | 224.8 | 203.4 |
| 2011 | 165.8 | 187.5 | 185.8 | 190.8 | 198.7 | 225.0 | 225.9 | 225.9 | 218.1 | 203.7 | 211.0 | 202.3 |
| 2012 | 177.7 | 193.3 | 195.8 | 215.3 | 235.4 | 243.0 | 228.5 | 222.7 | 189.6 | 204.8 | 201.9 | 196.5 |
| 2013 | 182.6 | 174.3 | 190.7 | 210.2 | 228.8 | 238.8 | 226.3 | 229.9 | 223.2 | 212.3 | 208.6 | 202.8 |
| 2014 | 186.1 | 185.1 | 193.6 | 215.6 | 226.8 | 235.2 | 244.2 | 232.6 | 221.9 | 219.4 | 215.8 | 208.7 |
| 2015 | 203.9 | 210.7 | 211.3 | 237.5 | 261.3 | 264.7 | 279.3 | 271.8 | 259.7 | 256.9 | 237.5 | 228.2 |
| 2016 | 204.0 | 225.5 | 232.5 | 253.5 | 265.6 | 272.0 | 276.0 | 270.8 | 274.6 | 258.0 | 260.4 | 220.8 |
| 2017 | 203.4 | 216.8 | 236.1 | 249.6 | 268.5 | 270.7 | 272.2 | 274.2 | 236.4 | 253.4 | 226.1 | 220.6 |
| 2018 | 183.5 | 191.3 | 214.4 | 228.8 | 237.2 | 250.2 | 260.5 | 264.9 | 247.7 | 244.6 | 248.5 | 231.5 |
| 2019 | 211.6 | 210.1 | 227.7 | 240.4 | 259.8 | 249.3 | 270.1 | 289.3 | 273.4 | 268.8 | 255.5 | 248.3 |
| 2020 | 224.6 | 233.8 | 233.5 | 189.5 | 243.3 | 288.5 | 300.5 | 295.1 | 296.8 | 288.6 | 270.7 | 254.5 |
| 2021 | 242.7 | 221.4 | 270.5 | 300.9 | 323.9 | 307.5 | 315.8 | 305.5 | 286.2 | 268.2 | 263.9 | 266.4 |
| 2022 | 212.5 | 228.3 | W | |||||||||
| - = No Data Reported; -- = Not Applicable; NA = Not Available; W = Withheld to avoid disclosure of individual company data. |
| Release Date: 5/19/2022 |
| Next Release Date: TBD |