|
Download Data (XLS File) |
|
||||||||
|
||||||||
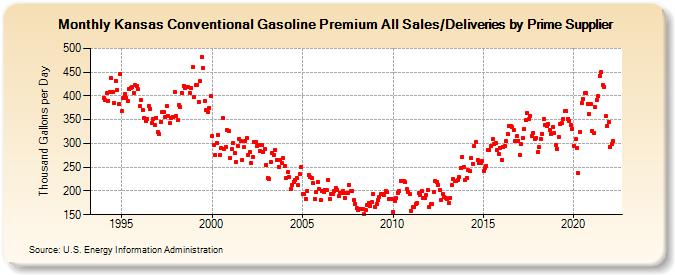
| Kansas Conventional Gasoline Premium All Sales/Deliveries by Prime Supplier (Thousand Gallons per Day) | ||||||||
| Year | Jan | Feb | Mar | Apr | May | Jun | Jul | Aug | Sep | Oct | Nov | Dec |
|---|---|---|---|---|---|---|---|---|---|---|---|---|
| 1993 | NA | NA | NA | |||||||||
| 1994 | 396.4 | 390.6 | 405.1 | 390.1 | 407.2 | 437.5 | 407.5 | 385.7 | 432.4 | 411.4 | 382.2 | 445.8 |
| 1995 | 367.6 | 395.0 | 404.0 | 396.5 | 389.0 | 415.1 | 416.2 | 417.8 | 406.5 | 422.4 | 420.4 | 413.8 |
| 1996 | 378.0 | 390.9 | 370.5 | 353.2 | 348.0 | 351.3 | 378.5 | 372.8 | 343.4 | 352.1 | 339.1 | 353.7 |
| 1997 | 324.0 | 318.9 | 345.1 | 365.3 | 367.0 | 355.8 | 378.5 | 358.6 | 342.3 | 354.0 | 354.9 | 408.9 |
| 1998 | 358.6 | 348.4 | 380.4 | 377.2 | 406.9 | 421.7 | 417.5 | 419.2 | 419.2 | 406.2 | 416.8 | 460.3 |
| 1999 | 397.9 | 422.4 | 423.8 | 387.3 | 430.6 | 482.2 | 458.8 | 388.5 | 370.3 | 365.3 | 375.3 | 398.8 |
| 2000 | 315.7 | 297.6 | 275.6 | 301.2 | 318.4 | 275.3 | 290.6 | 354.0 | 287.5 | 292.8 | 327.3 | 326.4 |
| 2001 | 269.5 | 288.2 | 300.7 | 280.3 | 260.6 | 294.7 | 309.4 | 304.1 | 266.0 | 291.9 | 305.3 | 310.5 |
| 2002 | 276.4 | 281.9 | 259.0 | 271.4 | 302.7 | 303.0 | 295.0 | 297.0 | 283.6 | 296.2 | 281.0 | 289.0 |
| 2003 | 254.3 | 226.6 | 226.1 | 261.2 | 280.7 | 276.1 | 286.9 | 265.4 | 251.3 | 264.3 | 259.7 | 269.1 |
| 2004 | 252.0 | 227.1 | 239.8 | 229.7 | 203.1 | 213.2 | 219.7 | 223.5 | 227.7 | 211.5 | 236.1 | 250.0 |
| 2005 | 193.6 | 193.3 | 183.7 | 200.2 | 233.6 | 228.8 | 227.5 | 216.1 | 183.5 | 196.8 | 219.7 | 204.0 |
| 2006 | 180.0 | 200.1 | 198.7 | 201.1 | 202.2 | 224.0 | 182.7 | 194.6 | 194.0 | 200.1 | 205.9 | 202.1 |
| 2007 | 189.2 | 195.3 | 196.1 | 199.8 | 185.7 | 196.5 | 195.0 | 213.2 | 198.9 | 200.1 | 181.3 | 172.9 |
| 2008 | 163.5 | 159.0 | 161.7 | 161.7 | 161.8 | 150.9 | 159.1 | 169.6 | 175.1 | 168.3 | 176.6 | 193.6 |
| 2009 | 166.2 | 171.6 | 180.5 | 187.5 | 193.2 | 194.2 | 191.6 | 199.4 | 196.8 | 182.8 | 183.3 | 183.5 |
| 2010 | 156.1 | 179.9 | 184.5 | 196.6 | 199.8 | 221.9 | 220.4 | 221.4 | 217.8 | 203.5 | 198.8 | 193.5 |
| 2011 | 157.7 | 165.6 | 165.3 | 173.0 | 175.3 | 195.0 | 191.9 | 199.7 | 186.1 | 185.1 | 191.0 | 201.8 |
| 2012 | 165.5 | 171.7 | 172.9 | 197.7 | 221.4 | 219.4 | 213.4 | 201.7 | 180.0 | 193.6 | 186.9 | 184.6 |
| 2013 | 183.9 | 175.1 | 185.7 | 212.1 | 225.1 | 221.1 | 220.9 | 222.8 | 228.8 | 248.5 | 271.2 | 250.9 |
| 2014 | 224.1 | 227.7 | 243.4 | 241.6 | 268.9 | 257.6 | 293.8 | 302.2 | 264.8 | 259.2 | 258.1 | 262.7 |
| 2015 | 241.4 | 248.4 | 252.9 | 286.8 | 286.3 | 294.7 | 309.4 | 298.7 | 300.8 | 286.7 | 277.9 | 291.4 |
| 2016 | 265.8 | 293.4 | 294.2 | 304.1 | 319.4 | 336.8 | 337.2 | 334.5 | 328.4 | 305.0 | 315.0 | 305.9 |
| 2017 | 276.1 | 298.1 | 312.4 | 330.6 | 348.5 | 364.1 | 350.4 | 357.8 | 315.3 | 322.5 | 310.3 | 312.3 |
| 2018 | 281.4 | 291.6 | 310.2 | 320.7 | 351.4 | 338.2 | 336.8 | 340.6 | 328.0 | 319.3 | 335.0 | 323.0 |
| 2019 | 296.3 | 289.0 | 313.8 | 341.5 | 342.1 | 351.3 | 367.8 | 368.2 | 352.4 | 347.4 | 338.0 | 330.1 |
| 2020 | 295.3 | 308.3 | 291.1 | 237.6 | 324.3 | 384.4 | 392.7 | 406.0 | 405.7 | 383.3 | 362.0 | 382.1 |
| 2021 | 326.6 | 322.7 | 376.5 | 391.1 | 399.2 | 442.9 | 449.6 | 422.0 | 419.4 | 356.8 | 336.2 | 345.5 |
| 2022 | 292.2 | 298.4 | 306.0 | |||||||||
| - = No Data Reported; -- = Not Applicable; NA = Not Available; W = Withheld to avoid disclosure of individual company data. |
| Release Date: 5/19/2022 |
| Next Release Date: TBD |