|
Download Data (XLS File) |
|
||||||||
|
||||||||
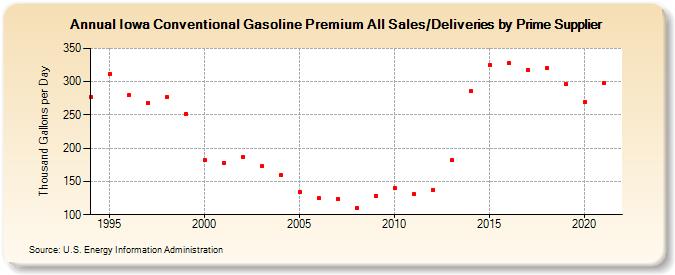
| Iowa Conventional Gasoline Premium All Sales/Deliveries by Prime Supplier (Thousand Gallons per Day) | ||||||||
| Decade | Year-0 | Year-1 | Year-2 | Year-3 | Year-4 | Year-5 | Year-6 | Year-7 | Year-8 | Year-9 |
|---|---|---|---|---|---|---|---|---|---|---|
| 1990's | 276.7 | 311.6 | 279.2 | 268.4 | 276.7 | 251.5 | ||||
| 2000's | 181.5 | 177.9 | 187.1 | 172.8 | 159.6 | 134.6 | 124.4 | 123.7 | 110.6 | 128.4 |
| 2010's | 140.3 | 131.1 | 137.6 | 181.7 | 285.3 | 324.7 | 327.3 | 318.1 | 320.3 | 296.2 |
| 2020's | 269.5 |
| - = No Data Reported; -- = Not Applicable; NA = Not Available; W = Withheld to avoid disclosure of individual company data. |
| Release Date: 6/1/2022 |
| Next Release Date: TBD |